. 2014 Mar 15;5(5):1212-25.
doi: 10.18632/oncotarget.1831.

SLC25A1, or CIC, is a novel transcriptional target of mutant p53 and a negative tumor prognostic marker

Affiliations

SLC25A1, or CIC, is a novel transcriptional target of mutant p53 and a negative tumor prognostic marker

Vamsi K Kolukula et al. Oncotarget. .

Abstract

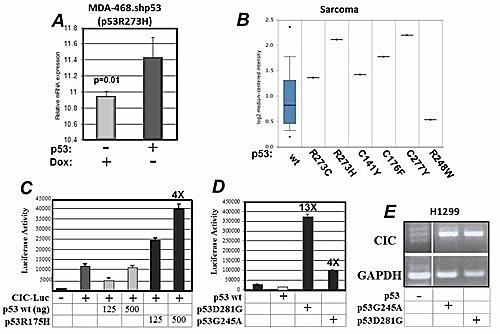
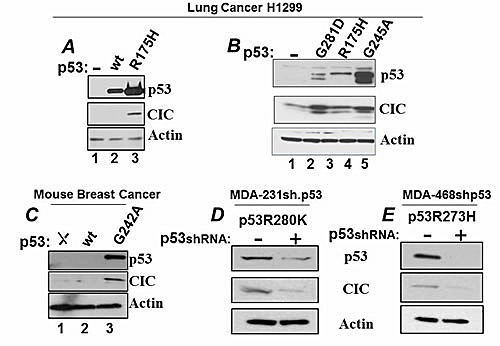
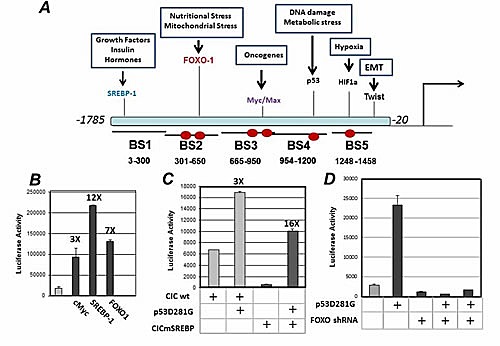
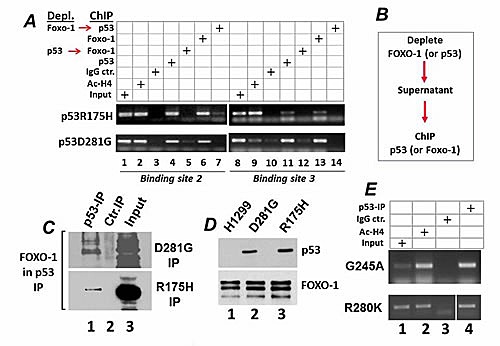
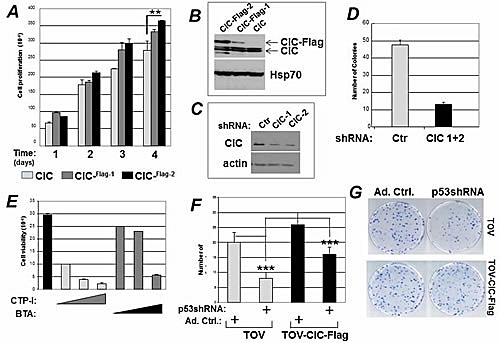
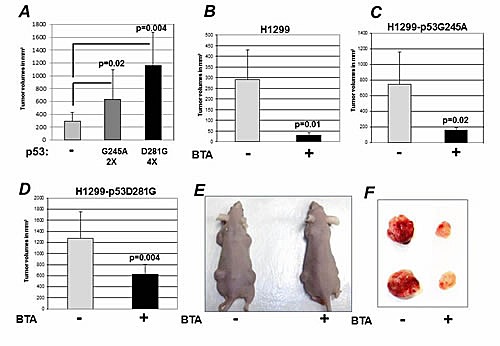
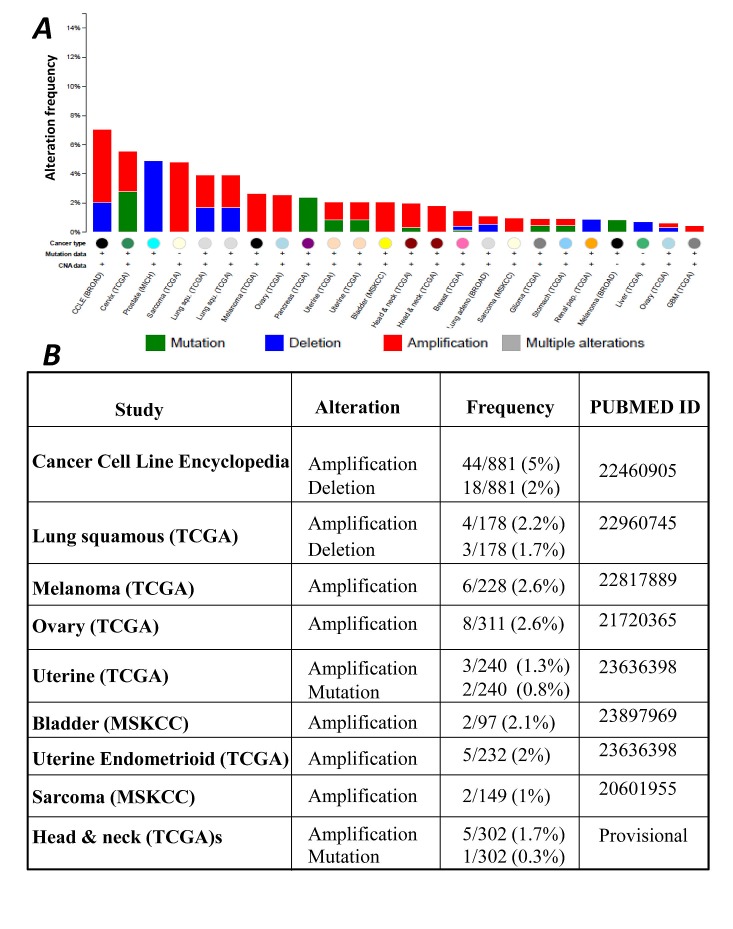
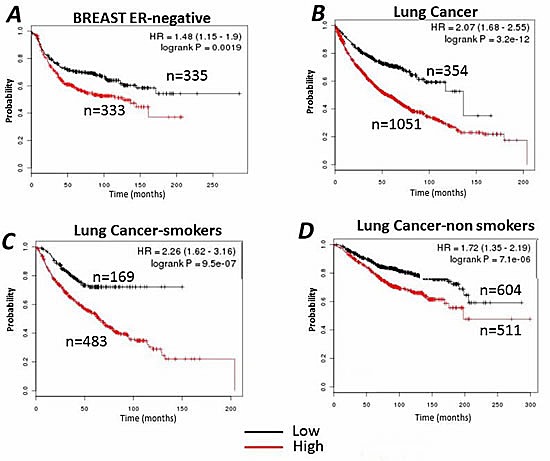
Mutations of the p53 gene hallmark many human cancers. Several p53 mutant proteins acquire the capability to promote cancer progression and metastasis, a phenomenon defined as Gain of Oncogenic Function (GOF). The downstream targets by which GOF p53 mutants perturb cellular programs relevant to oncogenesis are only partially known. We have previously demonstrated that SLC25A1 (CIC) promotes tumorigenesis, while its inhibition blunts tumor growth. We now report that CIC is a direct transcriptional target of several p53 mutants. We identify a novel interaction between mutant p53 (mutp53) and the transcription factor FOXO-1 which is responsible for regulation of CIC expression levels. Tumor cells harboring mutp53 display higher CIC levels relative to p53 null or wild-type tumors, and inhibition of CIC activity blunts mutp53-driven tumor growth, partially overcoming GOF activity. CIC inhibition also enhances the chemotherapeutic potential of platinum-based agents. Finally, we found that elevated CIC levels predict poor survival outcome in tumors hallmarked by high frequency of p53 mutations. Our results identify CIC as a novel target of mutp53 and imply that the employment of CIC inhibitors may improve survival rates and reduce chemo-resistance in tumors harboring these types of mutations, which are among the most intractable forms of cancers.


Figures

Figure 1
Figure 1
A. mRNA expression profiles derived from MDA-468shp53 cells grown in the presence or absence of doxycycline as described in [9,24] (tet-off). Data were extracted from the geoprofile database, plotted in an excel file and analyzed. B. Analysis of the Oncomine database for co-expression of CIC and p53 mutations. C. The p53 null H1299 lung cancer cells were non-transfected (−) or were transfected with the CIC-Luciferase vector (+) alone or with 120 or 500 ng of a vector expressing wild-type or p53R175H as indicated at the bottom of the panel. D. Similar luciferase experiments were performed by using two additional mutants p53G281D or p53G245A. E. Analysis of the CIC mRNA in H1299 cells, or in cells expressing p53G281 or p53G245A.
Figure 2
Figure 2. Expression of mutant p53 regulate CIC levels
A. Lane 1, H1299 transfected with control vector; lane 2: transfection with the wt-p53 expressing vector; lane 3: transfection with the p53R175H vector. Cell lysates derived from these transfection experiments were subjected to immuno-blot with the anti-p53 (upper panel); with the anti-CIC (second panel), or with anti-actin antibodies (lower panel). B. CIC levels in H1299 cells or in H1299 cells stably expressing the p53 mutants indicated at the top of the panel. C. CIC expression levels in isogenic cell lines derived from murine mammary tumor cancers. Three cell lines were used, p53-/- (lane 1), p53 wild-type (lane 2) or cells harboring a mutation at position 245 that replaces a glycine with an alanine (p53A242G; lane 3). D-E. MDA-231 (D) or MDA-468 cells (E), harboring a tetracycline-inducible vector (tet-off) expressing the p53 shRNA were grown in the presence of doxycycline (p53shRNA off), or in its absence (p53shRNA on), cell extracts were prepared and analyzed as described before.
Figure 3
Figure 3
A. In silico analysis of the human CIC promoter. The CIC promoter regions spanning from -1785 to -20 were analyzed with Mathinspector (Genomatix) or with the LASAGNA software for transcription factor binding sites. Binding sites for various transcription factors and their biological significance are indicated. The promoter was divided in five fragments, indicated as Binding Sites 1-5. Red ovals indicate the position of the FOXO-1 binding elements (see also Supplemental Figure S3). B. Luciferase assays performed with the CIC-luciferase vector, in the absence or presence of SREBP-1, cMyc, FOXO-1 and PTEN. C. H1299 cells were transfected either with wild-type CIC luciferase reporter or with the mutant lacking the SREBP-1 binding element in the presence or absence of 250 ng or 500 ng of p53D281G. D. H1299 cells were transfected with control shRNA or with the shRNA specific for FOXO-1, in the presence or absence of the p53D281G expressing vector.
Figure 4
Figure 4
A. Chromatin immuno-precipitation assays performed on the Binding Site 2 and 3 of the CIC promoter. The procedure for the immuno-depletion is schematically illustrated in B. Cell extracts were subjected to a first immuno-precipitation with the anti-p53 or anti-FOXO-1 antibody, and the supernatant of these reactions was used for the reciprocal ChIP with the anti-FOXO-1 or anti-p53 antibodies, respectively. In panel A cells expressing p53R175H or p53D281G were immuno-precipitated with antibodies directed against acetylated histone H4 (lanes 2 and 9), or with IgG control (lanes 3,10), or with anti-p53 DO1 antibody (lanes 4,11), or anti-FOXO-1 antibody (lanes 6,13). The supernatant of the cell extracts subjected to the first immuno-precipitation with the anti-p53 or anti-FOXO antibodies were then immuno-precipitated with the anti-FOXO-1 (lanes 7, 14), or anti-p53 (lanes 5 and 12) antibodies. Lane 1 contains input levels. C. Nuclear extracts derived from H1299 cells expressing p53R175H or p53D281G, as indicated at the right of each panel, were prepared and immuno-precipitated either with a control IgG antibody (lane 2), or with the anti-p53 antibody DO1 (lane 3). Lane 1 contains 1/50 of the total extracts, probed for FOXO-1. D. In parallel experiments the levels of p53 (upper panel) or FOXO-1 were assessed in the cell lines indicated at the top of the panel. E. ChIP assays were performed in cell extracts derived from cells expressing p53G245A (top panel), or from MDA-231 cells expressing p53R280K (bottom panel).
Figure 5
Figure 5. CIC affects the GOF activity of mutant p53
A. Naive TOV cells expressing endogenous CIC, or TOV multi-clonal populations harboring epitope-tagged CIC (CIC-Flag-1, CIC-Flag-2) were plated at 500 cells/well and their proliferative capacity was studied for four days. B. Immuno-blot showing the expression levels of endogenous CIC and the CIC-Flag clones in TOV cells. C. Expression levels of CIC in the presence of control shRNA, or of two specific CIC shRNAs. D. Colony forming assays in TOV cells transfected with the control shRNA, or with the CIC specific shRNA after one week of selection with puromycin. E. Cell viability assessed with trypan blue exclusion of H1299 cells treated with 0.1 mM, 0.5 mM or 1 mM of CTP-I or BTA. F-G. Naive TOV cells or TOV cells expressing CIC-Flag-2 were infected with control adenovirus, or with adenovirus harboring the specific p53 shRNA. Cells were plated and their colony forming ability was assessed.
Figure 6
Figure 6. Inhibition of CIC blunts the GOF activity of mutant p53
A. Naive H1299 cells, or H1299 cells expressing p53G245A or p53D281G mutant were injected in the flank of nude mice. Tumor volumes were assessed several weeks after implantation. B-D. Tumor volumes assessed after implantation in nude mice of naive H1299 cells or H1299 cells expressing p53G245A or p53D281G either mock treated (−) or BTA treated (+). Bars represent standard deviations; p-values between different groups are shown in all panels. E-F. Representative mice (E) or tumors (F) derived from these experiments are shown.
Figure 7
Figure 7
A. Spectrum of genomic alterations of SLC25A1 (CIC) across different human tumor types and cancer cell lines extracted from the cBioPortal database. B. The study, the type of alteration(s) and the pubmed ID reporting CIC alterations are summarized in the table.
Figure 8
Figure 8. Kaplan–Meier survival curves relative to SLC25A1 (CIC) expression were generated for breast cancer (A), or lung cancer (B)
Data were analyzed with the KM-plotter (http://kmplot.com/analysis/). In the case of lung cancer, the cohort of patients was divided into “smokers” (C) or “non smokers” and by allowing the software to select the best cut-off. Red and black lines indicate patients with higher and lower CIC expression respectively. The total number of patients in the two categories are shown. Hazard ratios (HR) and p values (log rank p) are shown at the top of the panel.

Similar articles

Cited by

References

    1. Vousden KH, Prives C. Blinded by the Light: The Growing Complexity of p53. Cell. 2009;137:413–31. - PubMed
    1. Freed-Pastor WA, Prives C. Mutant p53: one name, many proteins. Genes Dev. 2012;26:1268–86. - PMC - PubMed
    1. Muller PA, Vousden KH. p53 mutations in cancer. Nat Cell Biol. 2013;15:2–8. - PubMed
    1. Terzian T, Suh YA, Iwakuma T, Post SM, Neumann M, Lang GA, et al. The inherent instability of mutant p53 is alleviated by Mdm2 or p16INK4a loss. Genes Dev. 2008;22:1337–44. - PMC - PubMed
    1. Lang GA, Iwakuma T, Suh YA, Liu G, Rao VA, Parant JM, et al. Gain of function of a p53 hot spot mutation in a mouse model of Li-Fraumeni syndrome. Cell. 2004;119:861–2. - PubMed

Publication types

MeSH terms