. 2014 Apr;21(4):358-65.
doi: 10.1038/nsmb.2801. Epub 2014 Mar 30.

Global effects of the CSR-1 RNA interference pathway on the transcriptional landscape

Affiliations

Global effects of the CSR-1 RNA interference pathway on the transcriptional landscape

Germano Cecere et al. Nat Struct Mol Biol. 2014 Apr.

Abstract

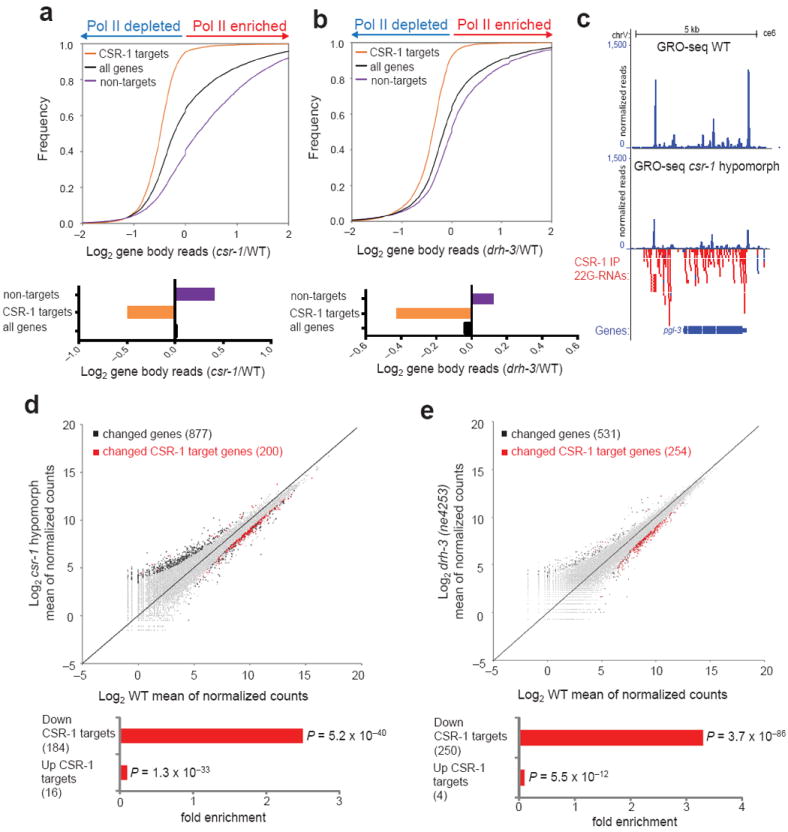
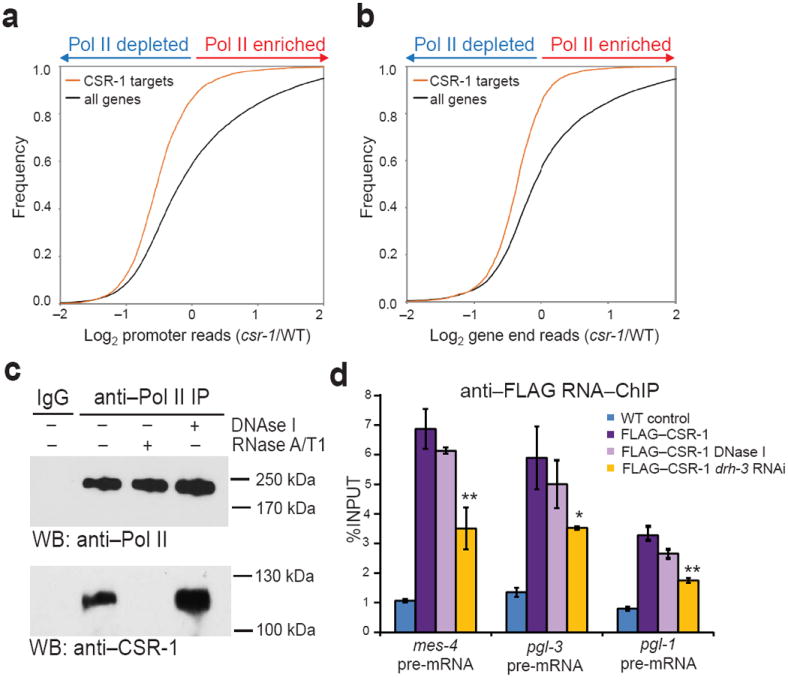
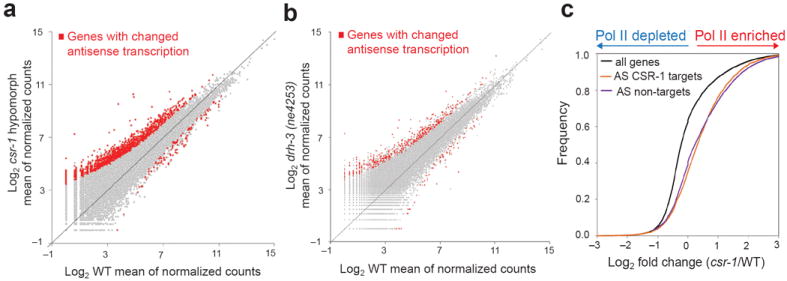
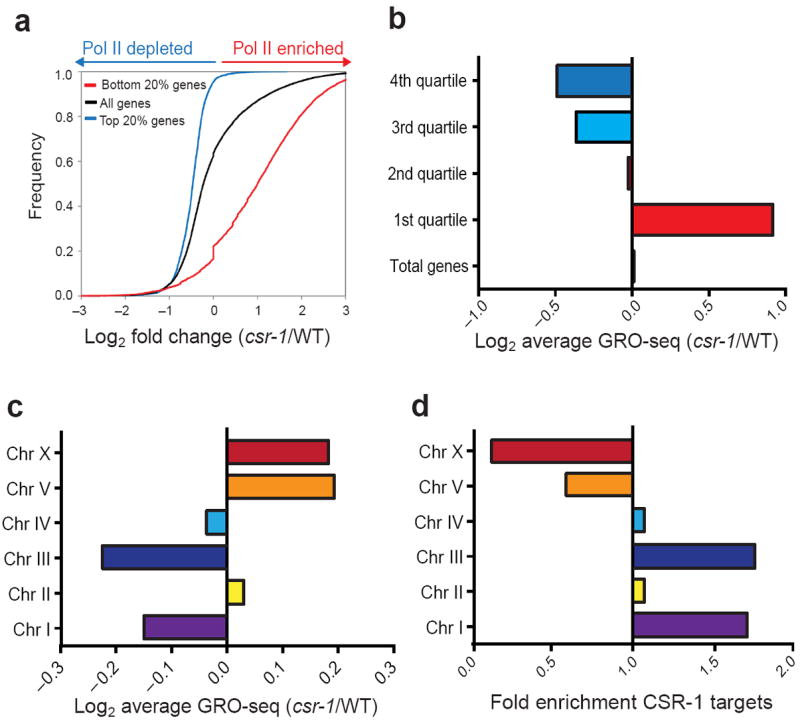
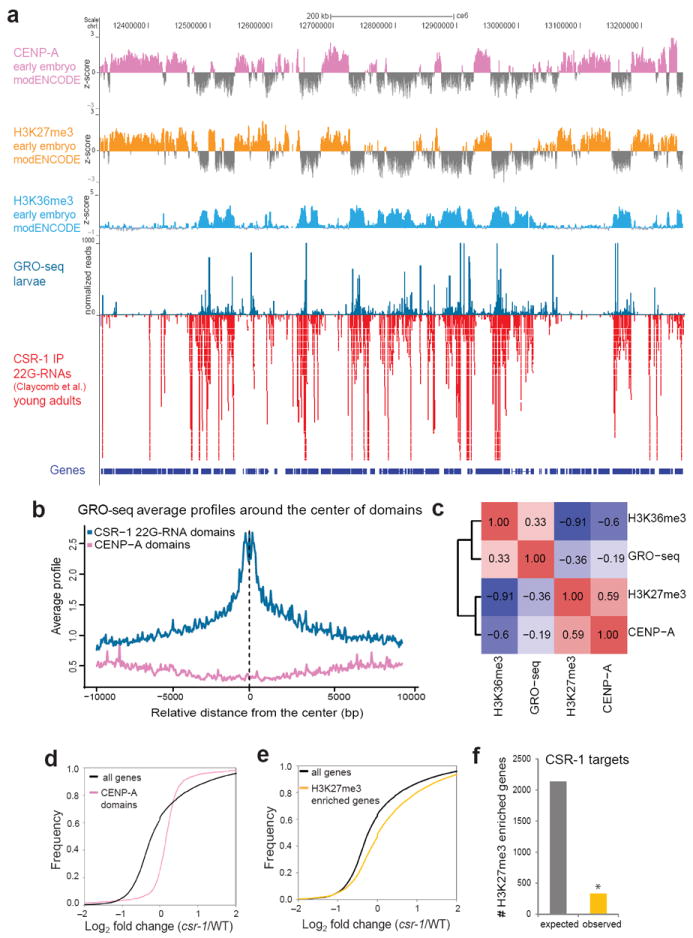
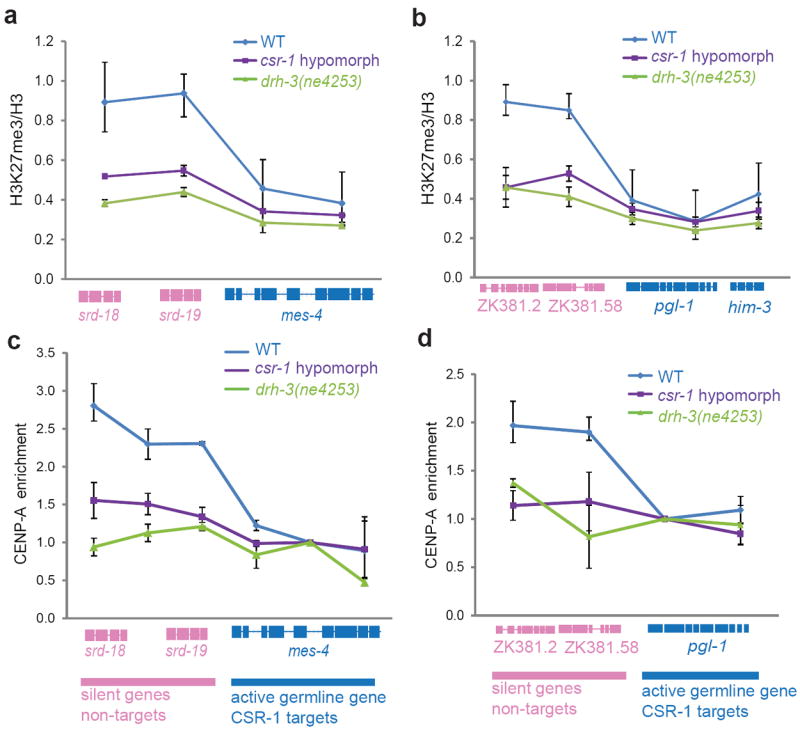
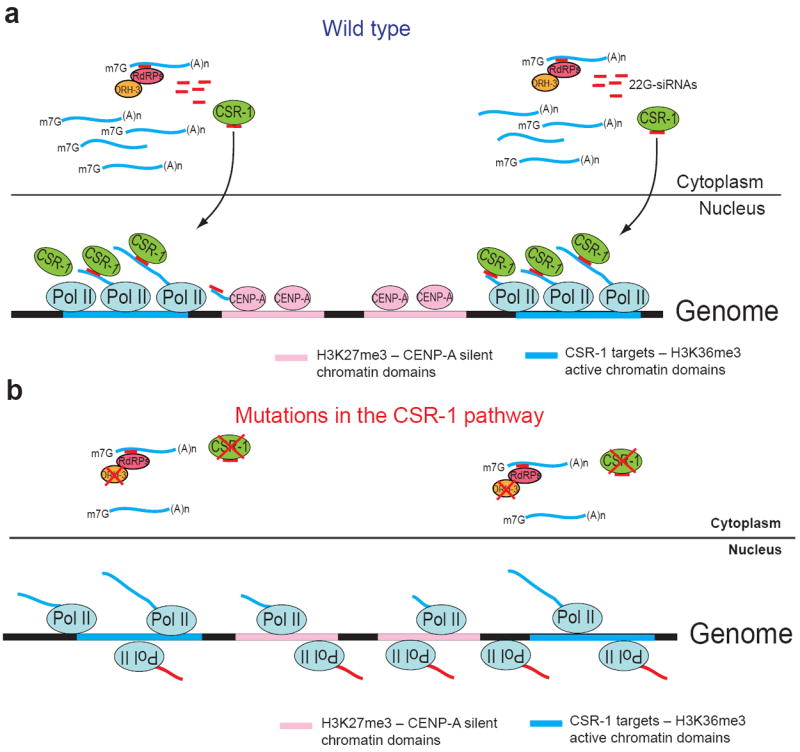
Argonaute proteins and their small RNA cofactors short interfering RNAs are known to inhibit gene expression at the transcriptional and post-transcriptional levels. In Caenorhabditis elegans, the Argonaute CSR-1 binds thousands of endogenous siRNAs (endo-siRNAs) that are antisense to germline transcripts. However, its role in gene expression regulation remains controversial. Here we used genome-wide profiling of nascent RNA transcripts and found that the CSR-1 RNA interference pathway promoted sense-oriented RNA polymerase II transcription. Moreover, a loss of CSR-1 function resulted in global increase in antisense transcription and ectopic transcription of silent chromatin domains, which led to reduced chromatin incorporation of centromere-specific histone H3. On the basis of these findings, we propose that the CSR-1 pathway helps maintain the directionality of active transcription, thereby propagating the distinction between transcriptionally active and silent genomic regions.


Conflict of interest statement

COMPETING FINANCIAL INTERESTS

The authors declare no competing financial interests.

Figures

Figure 1
Figure 1. CSR-1 pathway positively regulates Pol II transcription
(a) Top, cumulative distribution plots of normalized GRO-seq gene body reads (log2 of the csr-1/WT read ratio): CSR-1 targets, as defined in ref. , (orange line), non-target genes (purple line) and total genes (black line). Bottom, the averages of the log2 ratio between csr-1 hypomorphic mutant and WT normalized gene body reads. (b) GRO-seq analysis performed as in a, considering drh-3(ne4253) and WT normalized GRO-seq gene body reads. (c) An example of CSR-1 target gene, pgl-3. Track listing from top to bottom: normalized GRO-seq reads in WT larvae, normalized GRO-seq reads in csr-1 hypomorphic mutant larvae, and CSR-1 22G-RNAs. Gene models are based on UCSC Genome Browser (ce06). (d) Top, scatter plot of mean of normalized counts (log2) in csr-1 hypomorphic mutant or WT calculated using DESeq package. The black squares represent genes with significant changes in Pol II transcription considering a False Discovery Rate (FDR) of < 0.05. The red squares represent CSR-1 target genes with significant changes in Pol II transcription (FDR < 0.05). The number of significantly changed genes is shown in parentheses. Bottom, significant enrichment or depletion of CSR-1 targets among, respectively, genes up-regulated and down-regulated by GRO-seq in csr-1 mutant versus WT, P values for the significance of enrichment or depletion were calculated using Fisher’s exact test. (e) Top, scatter plot, as in d, of mean of normalized counts (log2) in drh-3 (ne4352) or WT. Bottom, significant enrichment or depletion of CSR-1 targets as in d.
Figure 2
Figure 2. CSR-1 interacts with Pol II and nascent transcripts
(a, b) Cumulative distribution plots of normalized GRO-seq promoter reads (log2 of the reads’ ratios: csr-1 hypomorph/WT or drh-3(ne4253)/WT): CSR-1 targets (orange line), and all genes (black line). (c) Co-immunopercipitation experiments with nuclear extracts treated or not with DNase I or RNase A/T1. The top panels show western blots with an antibody that recognizes the non-phosphorylated isoform of Pol II and the bottom panels show western blots with an antibody recognizing CSR-1. See Supplementary Fig. 8 for uncropped blot images. (d) RNA-ChIP-qPCR results obtained with an antibody against FLAG and nuclear extracts from non-transgenic worms (blue bars) or transgenic worms expressing FLAG–CSR-1 protein: without DNase I treatment (purple bars) or treated with DNase I (light purple bars). Yellow bars show results with FLAG–CSR-1 strain treated with RNAi against drh-3. Error bars, s.d. (n = 3 technical replicates). *P < 0.05; **P < 0.01 by one-tailed Student’s t test in comparison to the transgenic strain expressing FLAG–CSR-1 protein.
Figure 3
Figure 3. Increased antisense Pol II transcription in CSR-1 pathway mutants
(a, b) Scatter plots, as in Fig. 1d, e, of mean of normalized counts (log2) calculated using DESeq package and showing genes with statistically significant changes in antisense Pol II transcription in csr-1 hypomorph or drh-3(ne4253) mutants versus WT, respectively, (FDR < 0.05). (c) Cumulative distribution plots of normalized GRO-seq reads showing CSR-1 targets (antisense (AS) reads, orange line) and non-targets (AS reads, purple line) compared to the sense reads of all genes (black line). Only reads from the gene body were considered for the analyses shown in c.
Figure 4
Figure 4. Categories and chromosomal distributions of genes affected by CSR-1 pathway mutants
(a) Cumulative distribution plots of normalized GRO-seq reads showing changes in transcription in csr-1 hypomorph compared to WT: top 20% highly-transcribed genes (blue line), bottom 20% genes (red line) and all genes (black line). Only reads from the gene body were considered for this analysis. (b) The average of the log2 ratios between the csr-1 hypomorphic mutant and WT normalized gene body reads quantified for genes grouped by quartiles of expression, based on GRO-seq. (c) The averages of the log2 ratios between the csr-1 hypomorphic mutant and WT reads quantified for genes present on each autosome. (d) Enrichment or depletion of CSR-1 target genes among C. elegans chromosomes, see the formula used to calculate enrichment or depletion in online methods section.
Figure 5
Figure 5. Relationship between silent and active chromatin domains in CSR-1 pathway mutants
(a) A map of a portion of chromosome I, track listing from top to bottom: ChIP-chip peaks for CENP-A, H3K27me3 and H3K36me3 (early embryo data from modENCODE), GRO-seq reads (this study) and CSR-1-bound endo-siRNA reads. Gene models are based on UCSC Genome Browser (ce06). (b) Average GRO-seq profiles at CSR-1-associated endo-siRNA-enriched genomic domains (blue line) and at CENP-A-enriched domains (pink line). (c) A heatmap showing the genome-wide correlation coefficient values between GRO-seq reads and H3K36me3 ChIP-chip, CENP-A ChIP-chip and H3K27me3 ChIP-chip peaks (all ChIP-chip data are from modENCODE). Positive correlations are shown in red and negative correlations in blue. (d) Cumulative distribution plots of normalized GRO-seq reads showing changes in transcription in csr-1 hypomorph compared to WT at CENP-A-enriched domains (red line) compared to all genes (black line). (e) Cumulative distribution plots, as in d, at genes enriched in H3K27me3 (yellow line) compared to all genes (black line). (f) Expected (grey bar) and observed (orange bar) numbers of CSR-1 target genes among the genes enriched in H3K27me3. Asterisk indicates significance of less than expected by chance calculated using hypergeometric test, P < 0.0001.
Figure 6
Figure 6. Decrease in H3K27me3 and CENP-A chromatin localization in CSR-1 pathway mutant embryos
(a, b) ChIP-qPCR results showing the levels of H3K27me3 normalized to the total levels of histone H3 at two genomic loci in WT, csr-1 hypomorph and drh-3(ne4253) mutants. Genes colored in pink correspond to the non-target silent genes that increase in transcription in mutant larvae and genes colored in blue are active germline-specific CSR-1 target genes that decrease in transcription in CSR-1 pathway mutant larvae. Bars indicate ranges, (n = 2 biological replicates). Gene models are based on UCSC Genome Browser (ce06). (c, d) ChIP-qPCR as in a, b, showing the enrichment of CENP-A on chromatin in WT and csr-1 hypomorph and drh-3(ne4253) mutants. The enrichment of CENP-A has been calculated relative to a region in the CSR-1 target genes for each locus considered (circles). Bars indicate ranges, (n = 2 biological replicates).
Figure 7
Figure 7. Model illustrating the proposed role of the CSR-1 pathway in regulation of Pol II transcription and chromatin organization
(a) Cytoplasmic mRNAs derived from actively transcribed regions are used as templates by RdRP complexes containing DRH-3 to produce antisense 22G-RNAs that are loaded onto CSR-1 Argonaute. CSR-1 and its associated siRNAs translocate into the nucleus where they interact with complementary nascent RNA transcripts to promote and localize Pol II transcription on active genes and to inhibit sense and antisense transcription at the silent chromatin regions. This leads to the reinforcement of the distinction between active and silent chromatin domains. (b) Impaired function of the components of the CSR-1 pathway (such as CSR-1 or DRH-3) leads to the reduction in the levels of Pol II transcription on active genes and results in the ectopic sense and antisense transcription. Ectopic transcription at normally silent chromatin domains leads to reduced CENP-A incorporation and to the loss of robust differences between active and silent chromatin.

Comment in

References

    1. Grewal SI. RNAi-dependent formation of heterochromatin and its diverse functions. Curr Opin Genet Dev. 2010;20:134–41. - PMC - PubMed
    1. Kim VN, Han J, Siomi MC. Biogenesis of small RNAs in animals. Nat Rev Mol Cell Biol. 2009;10:126–39. - PubMed
    1. Hammond SM. Dicing and slicing: the core machinery of the RNA interference pathway. FEBS Lett. 2005;579:5822–9. - PubMed
    1. Ambros V, Lee RC, Lavanway A, Williams PT, Jewell D. MicroRNAs and other tiny endogenous RNAs in C. elegans. Curr Biol. 2003;13:807–18. - PubMed
    1. Okamura K, Lai EC. Endogenous small interfering RNAs in animals. Nat Rev Mol Cell Biol. 2008;9:673–8. - PMC - PubMed

Publication types

MeSH terms

Associated data