

Time-varying causal inference from phosphoproteomic measurements in macrophage cells
- PMID: 24681921
- PMCID: PMC4631079
- DOI: 10.1109/TBCAS.2013.2288035
Time-varying causal inference from phosphoproteomic measurements in macrophage cells
Abstract
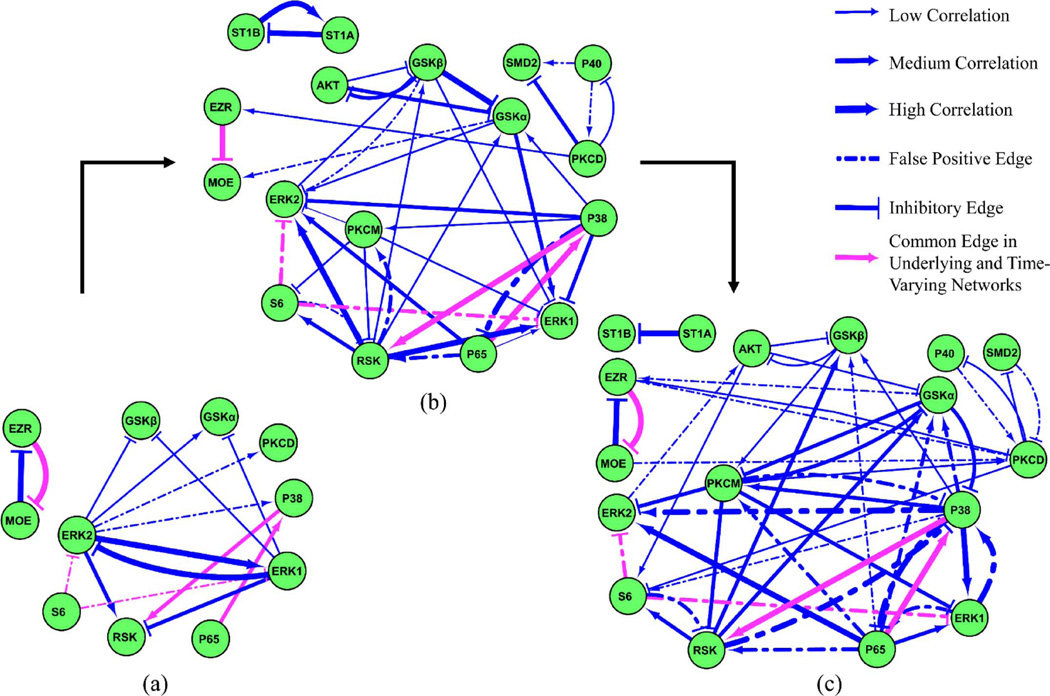
Cellular signaling circuitry in eukaryotes can be studied by analyzing the regulation of protein phosphorylation and its impact on downstream mechanisms leading to a phenotype. A primary role of phosphorylation is to act as a switch to turn "on" or "off" a protein activity or a cellular pathway. Specifically, protein phosphorylation is a major leit motif for transducing molecular signals inside the cell. Errors in transferring cellular information can alter the normal function and may lead to diseases such as cancer; an accurate reconstruction of the "true" signaling network is essential for understanding the molecular machinery involved in normal and pathological function. In this study, we have developed a novel framework for time-dependent reconstruction of signaling networks involved in the activation of macrophage cells leading to an inflammatory response. Several signaling pathways have been identified in macrophage cells, but the time-varying causal relationship that can produce a dynamic directed graph of these molecules has not been explored in detail. Here, we use the notion of Granger causality, and apply a vector autoregressive model to phosphoprotein time-course data in RAW 264.7 macrophage cells. Through the reconstruction of the phosphoprotein network, we were able to estimate the directionality and the dynamics of information flow. Significant interactions were selected through statistical hypothesis testing ( t-test) of the coefficients of a linear model and were used to reconstruct the phosphoprotein signaling network. Our approach results in a three-stage phosphoprotein network that represents the evolution of the causal interactions in the intracellular signaling pathways.
Figures
Similar articles
-
Identification of crosstalk between phosphoprotein signaling pathways in RAW 264.7 macrophage cells.PLoS Comput Biol. 2010 Jan 29;6(1):e1000654. doi: 10.1371/journal.pcbi.1000654. PLoS Comput Biol. 2010. PMID: 20126526 Free PMC article.
-
Information theoretic approach to complex biological network reconstruction: application to cytokine release in RAW 264.7 macrophages.BMC Syst Biol. 2014 Jun 25;8:77. doi: 10.1186/1752-0509-8-77. BMC Syst Biol. 2014. PMID: 24964861 Free PMC article.
-
Reconstruction of global regulatory network from signaling to cellular functions using phosphoproteomic data.Genes Cells. 2019 Jan;24(1):82-93. doi: 10.1111/gtc.12655. Epub 2018 Dec 16. Genes Cells. 2019. PMID: 30417516
-
Phosphoproteomic approaches to elucidate cellular signaling networks.Curr Opin Biotechnol. 2006 Aug;17(4):406-14. doi: 10.1016/j.copbio.2006.06.004. Epub 2006 Jun 27. Curr Opin Biotechnol. 2006. PMID: 16806894 Review.
-
Integration of phosphoproteomic, chemical, and biological strategies for the functional analysis of targeted protein phosphorylation.Proteomics. 2013 Feb;13(3-4):424-37. doi: 10.1002/pmic.201200274. Epub 2013 Jan 2. Proteomics. 2013. PMID: 23125184 Review.
Cited by
-
Time varying causal network reconstruction of a mouse cell cycle.BMC Bioinformatics. 2019 May 29;20(1):294. doi: 10.1186/s12859-019-2895-1. BMC Bioinformatics. 2019. PMID: 31142274 Free PMC article.
References
-
- Hunter T. Protein kinases and phosphatases: The yin and yang of protein phosphorylation and signaling. Cell. 1995 Jan.80:225–236. - PubMed
-
- Papin JA, Hunter T, Palsson BO, Subramaniam S. Reconstruction of cellular signalling networks and analysis of their properties. Nat. Rev. Mol. Cell. Biol. 2005 Feb.6:99–111. - PubMed
Publication types
MeSH terms
Substances
Grants and funding
LinkOut - more resources
Full Text Sources
Other Literature Sources
