. 2015 Mar 5;34(10):1253-1262.
doi: 10.1038/onc.2014.77. Epub 2014 Mar 31.

A targeted knockdown screen of genes coding for phosphoinositide modulators identifies PIP4K2A as required for acute myeloid leukemia cell proliferation and survival

Affiliations

A targeted knockdown screen of genes coding for phosphoinositide modulators identifies PIP4K2A as required for acute myeloid leukemia cell proliferation and survival

Julian G Jude et al. Oncogene. .

Abstract

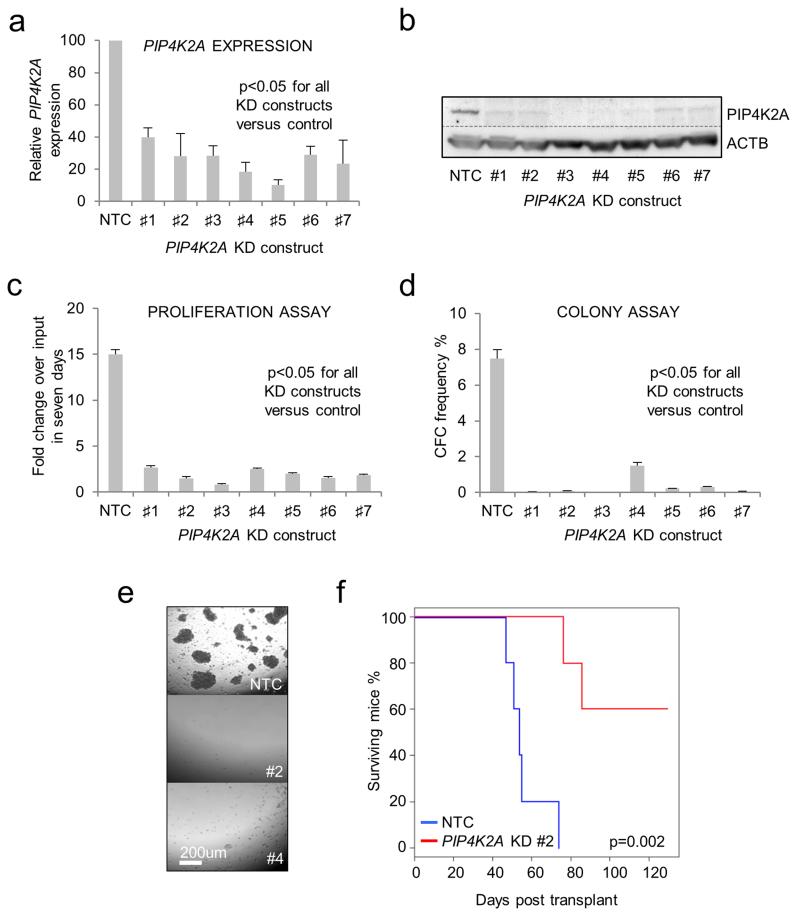
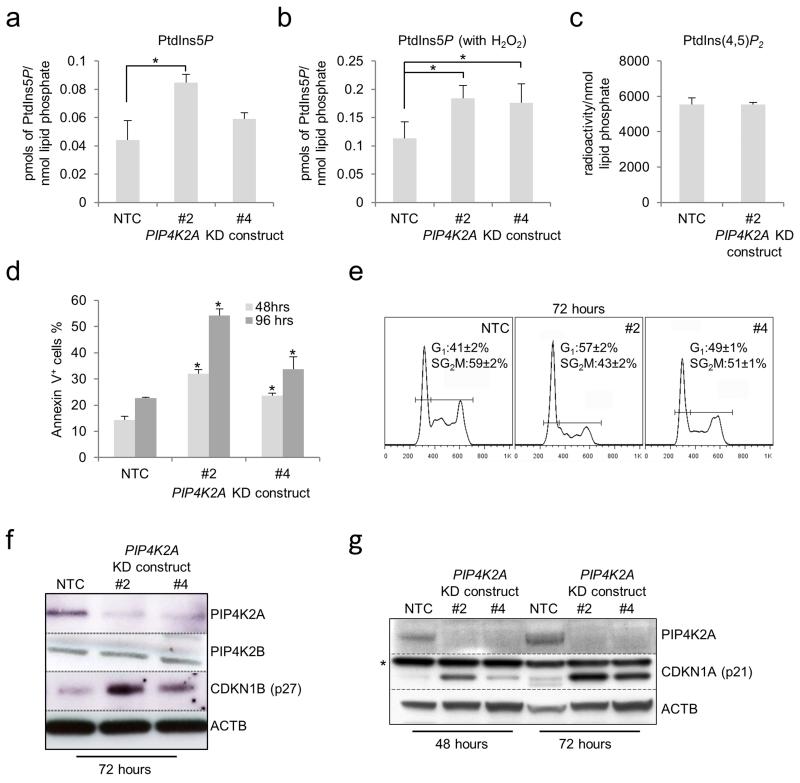
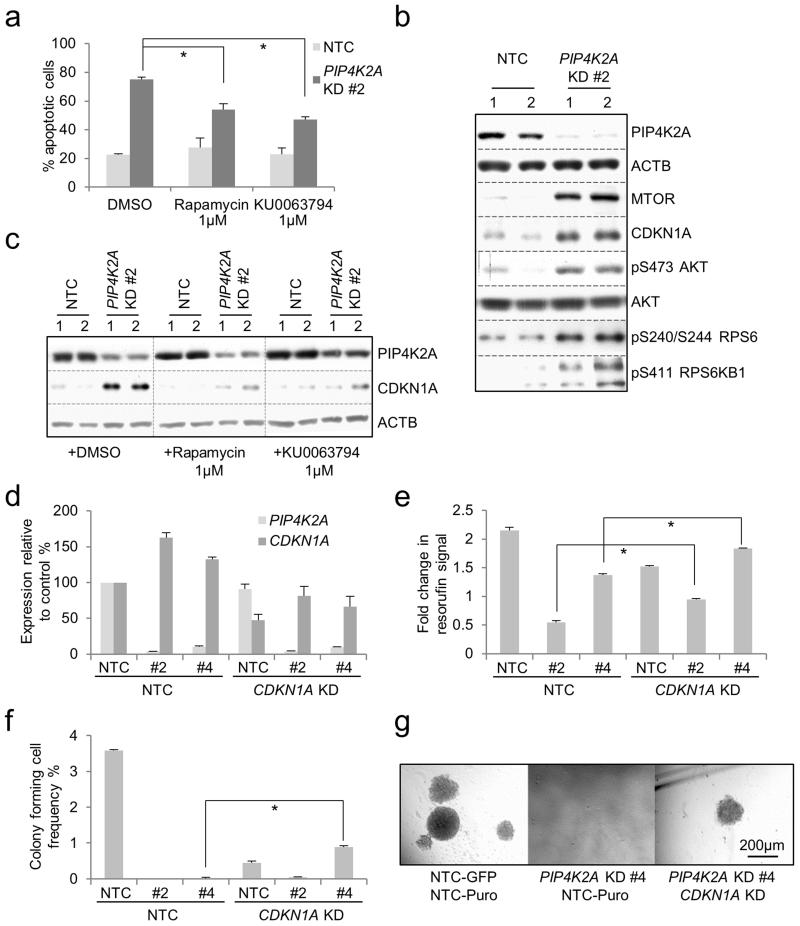
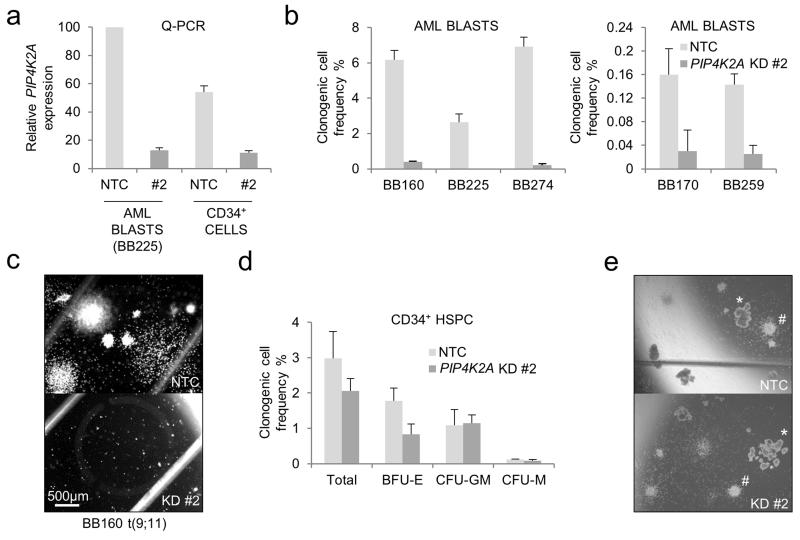
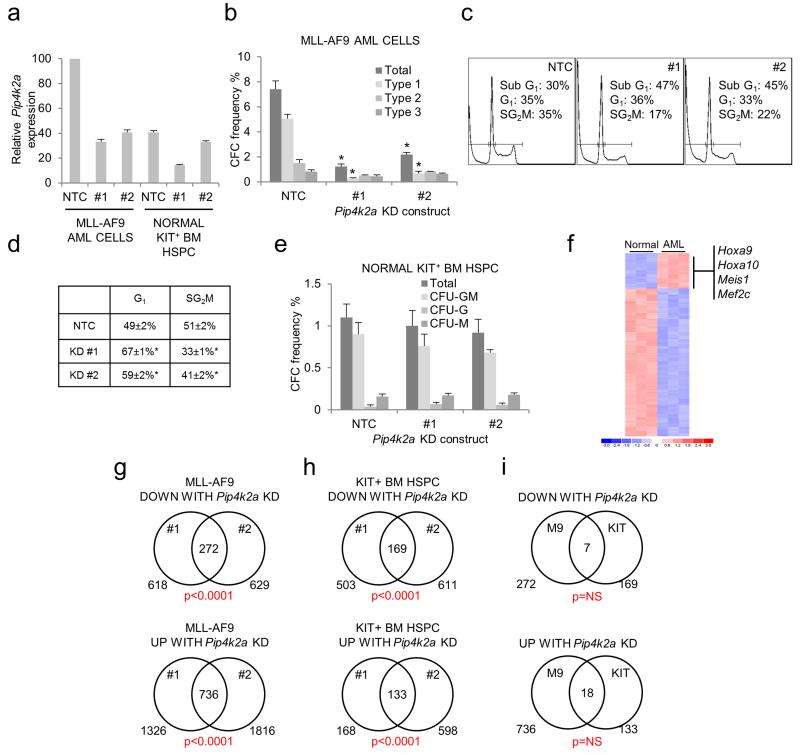
Given the importance of deregulated phosphoinositide (PI) signaling in leukemic hematopoiesis, genes coding for proteins that regulate PI metabolism may have significant and as yet unappreciated roles in leukemia. We performed a targeted knockdown (KD) screen of PI modulator genes in human acute myeloid leukemia (AML) cells and identified candidates required to sustain proliferation or prevent apoptosis. One of these, the lipid kinase phosphatidylinositol-5-phosphate 4-kinase, type II, alpha (PIP4K2A) regulates cellular levels of phosphatidylinositol-5-phosphate (PtsIns5P) and phosphatidylinositol 4,5-bisphosphate (PtdIns(4,5)P₂). We found PIP4K2A to be essential for the clonogenic and leukemia-initiating potential of human AML cells, and for the clonogenic potential of murine MLL-AF9 AML cells. Importantly, PIP4K2A is also required for the clonogenic potential of primary human AML cells. Its KD results in accumulation of the cyclin-dependent kinase inhibitors CDKN1A and CDKN1B, G₁ cell cycle arrest and apoptosis. Both CDKN1A accumulation and apoptosis were partially dependent on activation of the mTOR pathway. Critically, however, PIP4K2A KD in normal hematopoietic stem and progenitor cells, both murine and human, did not adversely impact either clonogenic or multilineage differentiation potential, indicating a selective dependency that we suggest may be the consequence of the regulation of different transcriptional programs in normal versus malignant cells. Thus, PIP4K2A is a novel candidate therapeutic target in myeloid malignancy.


Figures

Figure 1
Figure 1
Loss of clonogenic and leukemia-initiating potential in PIP4K2A KD human THP1 AML cells. Human THP1 AML cells were infected with lentiviral vectors targeting PIP4K2A for KD, or a non-targeting control (NTC), with puromycin as the selectable marker. Cells were treated with puromycin for 48 hours to kill untransduced cells. Typical transduction efficiencies were 90-100%. (a) Bar chart shows mean±SEM expression of PIP4K2A relative to control cells, as determined by quantitative PCR, 72 hours following lentiviral infection and initiation of KD (n=4). (b) Representative western blot shows expression of PIP4K2A and ACTB 72 hours following initiation of KD. Bar charts show mean±SEM (c) fold expansion in cell number over input, as determined by hemocytometer counting, in a seven day liquid culture proliferation assay (n=3), and (d) colony forming cell (CFC) frequencies (n=3), of control and PIP4K2A KD cells. Assays were initiated 72 hours following lentiviral infection with cell viability confirmed by trypan blue dye exclusion. (e) Representative image shows THP1 AML cell colonies enumerated 10 days following assay initiation. (f) Survival curve of mice xenotransplanted with 104 control or PIP4K2A KD AML cells. Viability of transplanted cells was confirmed by Trypan Blue dye exclusion. For (a, c & d) significance was assessed by one way ANOVA followed by Fisher’s least significant difference post hoc test; for (f) by log rank test.
Figure 2
Figure 2
Consequences of PIP4K2A KD in human THP1 AML cells. Human THP1 AML cells were infected with lentiviral vectors targeting PIP4K2A for KD, or a non-targeting control (NTC), with eGFP as the selectable marker. Bar charts show mean±STDEV (a) whole cell PtdIns5P levels, (b) whole cell PtdIns5P levels following 40 minutes of treatment of cells with 1mM H2O2 and (c) whole cell PtdIns(4,5)P2 levels in THP1 cells 48 hours following lentiviral infection with the indicated control or KD constructs (n=3). * indicates p<0.05, as assessed by one way ANOVA followed by Fisher’s least significant difference post hoc test. (d) Bar chart shows mean±SEM percentage of control or PIP4K2A KD cells exhibiting annexin V binding at the indicated time points following lentiviral infection (n=3). In each case >95% of cells were eGFP positive. * indicates p<0.05 by comparison with control cells at the same time point, as determined by one way ANOVA followed by Fisher’s least significant difference post hoc test. (e) Representative cell cycle profiles (excluding sub-G1 apoptotic cells) from control and PIP4K2A KD cells 72 hours following initiation of KD. Numbers indicate mean±SEM percentage of cells in each phase of the cell cycle from three separate experiments (p<0.05 for NTC versus #2 or #4, as determined by one way ANOVA followed by Fisher’s least significant difference post hoc test). (f & g) Representative western blots show expression of the indicated proteins in control and PIP4K2A KD cells 48 or 72 hours following initiation of KD. * indicates a non-specific band.
Figure 3
Figure 3
Apoptosis and induction of CDKN1A after PIP4K2A KD is dependent on MTOR. Human THP1 AML cells were infected with a lentiviral vector targeting PIP4K2A for KD, or a non-targeting control (NTC), with puromycin as the selectable marker. Cells were treated with puromycin for 48 hours to kill untransduced cells. Control and KD cells demonstrated similar viabilities at this time point, indicating equivalent transduction rates (data not shown). (a) Bar chart shows mean±SEM percentage of apoptotic cells seven days following lentiviral infection for the indicated conditions, as determined by annexin V binding (n=6). * indicates p<0.001 using one-way ANOVA followed by Fisher’s least significant difference post hoc test. (b) & (c) Western blots show expression of the indicated proteins, and in the indicated conditions, in THP1 AML cells 72 hours following lentiviral infection. Data from two separate experiments are shown (lanes 1 & 2 for each condition). (d-g) THP1 cells were double infected with lentiviral vectors targeting PIP4K2A or CDKN1A for KD, or a non-targeting control, with GFP and puromycin as selectable markers. Puromycin was added 24 hours later and viable GFP+ cells were FACS purified 48 hours following spinfection. Bar charts show (d) mean±SEM expression of PIP4K2A and CDKN1A relative to control cells, as determined by quantitative PCR, in FACS purified cells 72 hours following lentiviral infection (n=6); (e) mean±SEM fold change in resorufin (alamarBlue) signal of puromycin-resistant, GFP+ cells cultured for 72 hours following FACS purification (n=3); and (f) mean±SEM colony forming cell (CFC) frequencies (n=3) for the indicated control and KD conditions (n=3). For (e) and (f), * indicates p<0.01 for the indicated comparisons, as determined by an unpaired t-test. (g) Representative images from (f).
Figure 4
Figure 4
Selective requirement for PIP4K2A in primary human AML cells. Primary human normal CD34+ HSPC or AML cells were infected with lentiviral vectors targeting PIP4K2A for KD, or a non-targeting control (NTC), with eGFP as the selectable marker. GFP+ cells were FACS purified 48 hours later. Typical transduction efficiencies for both cell types were 20-50%. (a) Bar chart shows mean±SEM (of triplicate analyses) expression of PIP4K2A relative to control AML blasts for the indicated normal and leukemic populations, as determined by quantitative PCR, 48 hours following initiation of KD. (b) Bar charts shows mean clonogenic cell frequencies of primary AML blasts from five separate patients (see Supplementary Table 2) infected with control or PIP4K2A KD lentiviral vectors. Error bars refer to SEM of triplicate analyses. BB numbers refer to the Biobank identifier. Data are shown in two graphs with different y-axes due to the inherent variability in clonogenic cell frequencies between samples from different patients. (c) Representative image from (b). Scale bar applies to images shown in (c) and (e). (d) Bar chart shows mean±SEM frequencies of the indicated colony forming cells (n= 3, separate donors) (BFU-E – erythroid burst-forming unit; CFU-GM – granulocyte/macrophage colony forming unit; CFU-M – macrophage colony forming unit). (e) Representative image from (d). # indicates CFU-GM; * indicates BFU-E.
Figure 5
Figure 5
Selective requirement for Pip4k2a in murine MLL-AF9 AML cells. Murine normal KIT+ or MLL-AF9 AML cells were infected with lentiviral vectors targeting Pip4k2a for KD, or a non-targeting control (NTC), with eGFP as the selectable marker. GFP+ cells were FACS purified 48 hours following lentiviral infection and initiation of KD. (a) Bar chart shows mean±SEM (of triplicate analyses) expression of Pip4k2a relative to control MLL-AF9 AML cells for the indicated normal and leukemic populations, as determined by quantitative PCR, 48 hours following initiation of KD. (b) Bar chart shows mean±SEM colony forming cell (CFC) frequencies (n=3) of control and Pip4k2a KD MLL-AF9 AML cells. * indicates p<0.05 by comparison with control cells, as determined by one way ANOVA followed by Fisher’s least significant difference post hoc test. (c) Representative cell cycle profiles show the proportion of MLL-AF9 AML cells in each stage of the cell cycle, or sub-G1 apoptotic cells, in control or Pip4k2a KD cells 96 hours following initiation of KD. (d) Excluding sub-G1 cells and related to (c), table indicates mean±SEM percentage of murine MLL-AF9 AML cells in the indicated phase of the cell cycle (n=3 triplicate analyses). * indicates p<0.05 by comparison with control cells, as determined by one way ANOVA followed by Fisher’s least significant difference post hoc test. (e) Bar chart shows mean±SEM colony forming cell (CFC) frequencies (n=3) of control and Pip4k2a KD KIT+ normal HSPC. (f) Heat map represents 421 protein coding genes significantly up or down regulated (p<0.001 (unpaired t-test) and more than two-fold change in expression) in MLL-AF9 AML cells by comparison with KIT+ HSPC, with key genes highlighted. Color scale indicates normalized expression values. Venn diagrams indicate numbers of protein coding genes up or down regulated (defined as those whose expression increased or decreased by 25% compared with control samples) following Pip4k2a KD for each of the tested KD constructs (#1 and #2) in (g) MLL-AF9 AML cells and (h) KIT+ BM HSPC. The number of co-regulated genes is shown in the intersect, together with the significance of the overlap (Chi-square test). (i) Venn diagrams indicate extent of overlap of genes up or down regulated by Pip4k2a KD in MLL-AF9 AML cells (M9) or KIT+ BM HSPC (KIT).

References

    1. Bunney TD, Katan M. Phosphoinositide signalling in cancer: beyond PI3K and PTEN. Nat Rev Cancer. 2010 May;10(5):342–352. - PubMed
    1. Di Paolo G, De Camilli P. Phosphoinositides in cell regulation and membrane dynamics. Nature. 2006 Oct 12;443(7112):651–657. - PubMed
    1. Lemmon MA. Membrane recognition by phospholipid-binding domains. Nat Rev Mol Cell Biol. 2008 Feb;9(2):99–111. - PubMed
    1. Martelli AM, Nyakern M, Tabellini G, Bortul R, Tazzari PL, Evangelisti C, et al. Phosphoinositide 3-kinase/Akt signaling pathway and its therapeutical implications for human acute myeloid leukemia. Leukemia. 2006 Jun;20(6):911–928. - PubMed
    1. Polak R, Buitenhuis M. The PI3K/PKB signaling module as key regulator of hematopoiesis: implications for therapeutic strategies in leukemia. Blood. 2012 Jan 26;119(4):911–923. - PubMed

Publication types

MeSH terms

Substances

LinkOut - more resources