

Review
doi: 10.1038/clpt.2014.70.
Epub 2014 Mar 28.
Using positron emission tomography to study transporter-mediated drug-drug interactions in tissues
Affiliations
- PMID: 24682030
- PMCID: PMC4153445
- DOI: 10.1038/clpt.2014.70
Item in Clipboard
Review
Using positron emission tomography to study transporter-mediated drug-drug interactions in tissues
Clin Pharmacol Ther.
2014 Aug.
Abstract
Drug disposition is highly regulated by membrane transporters. Some transporter-mediated drug-drug interactions (DDIs) may not manifest themselves in changes in systemic exposure but rather in changes in tissue exposure of drugs. To better assess the impact of transporter-mediated DDIs in tissues, positron emission tomography (PET)-a noninvasive imaging method--plays an increasingly important role. In this article, we provide examples of how PET can be used to assess transporter-mediated DDIs in different organs.
Conflict of interest statement
The authors declared no conflict of interest.
Figures
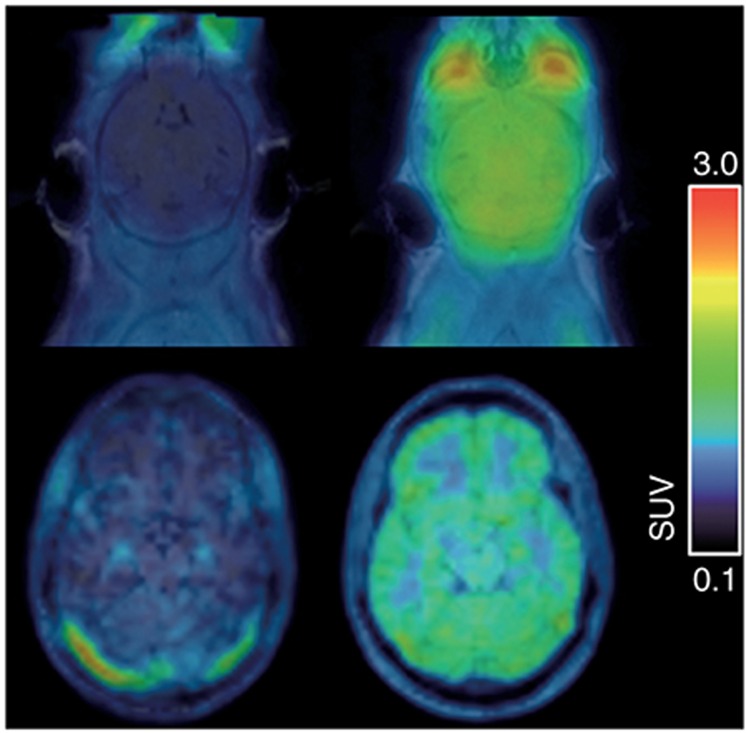
Translational positron emission tomography (PET) imaging of the P-glycoprotein-mediated interaction between (R)-[11C]verapamil and tariquidar at the mouse (C57BL/6, upper row) and human blood–brain barrier (lower row). Left, magnetic resonance imaging-coregistered PET summation images (0–60 min) at baseline and, right, at 2 h (mouse) or 1 h (human) after i.v. administration of tariquidar (mouse: 15 mg/kg over 1 min, human: 8 mg/kg over 160 min) are shown. Tariquidar plasma concentrations at the end of the PET scan were similar in the shown mouse (1,297 ng/ml) and the human volunteer (1,241 ng/ml). In mice, a 4.9-fold and in humans, a 2.0-fold increase relative to baseline in the brain-to-plasma ratio of (R)-[11C]verapamil at 60 min after injection (Kp,brain) was observed. Mean baseline Kp,brain values before tariquidar administration were 0.43 ± 0.05 (n = 6) for mice and 0.55 ± 0.06 (n = 6) for humans. Radioactivity concentration is normalized to injected dose per kilogram body weight and expressed as a standardized uptake value.

Preclinical positron emission tomography (PET)-based drug–drug interaction study between the P-glycoprotein (Pgp) substrate (R)-[11C]verapamil and the Pgp inhibitor tariquidar using Friend virus B-type (FVB) wild-type and transporter knockout mice. Shown are coronal (R)-[11C]verapamil PET summation images (0–60 min) for paired scans acquired before (upper row) and after (lower row) i.v. pretreatment with tariquidar (15 mg/kg, 2 h before start of second PET scan). Radiation scale is expressed as a standardized uptake value. In PET scans before tariquidar pretreatment, brain uptake of (R)-[11C]verapamil was low in animals expressing Pgp (wild-type and Bcrp1−/−) and high in animals lacking Pgp (Mdr1a/b−/− and Mdr1a/b−/−Bcrp1−/−). Following Pgp inhibition with tariquidar, brain uptake of (R)-[11C]verapamil was within a comparable range in all four mouse types. Taken together, these data demonstrate that (R)-[11C]verapamil is transported by Pgp at the mouse blood–brain barrier and not by breast cancer resistance protein.
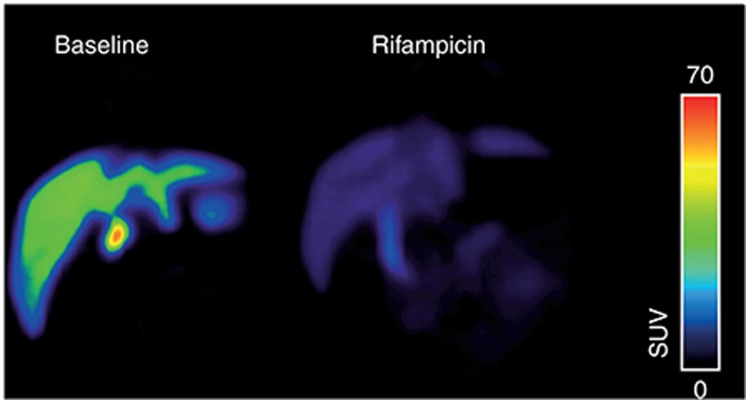
Organic anion–transporting polypeptide–mediated interaction between [11C]glyburide and rifampicin in baboon (Papio anubis) liver. Shown are coronal positron emission tomography (PET) summation images (0–60 min) acquired after injection of [11C]glyburide without (left) and with (right) i.v. pretreatment with rifampicin (8.6 mg/kg over 30 min immediately before PET). Radiation scale is expressed as standardized uptake value. After rifampicin pretreatment, the area under the liver time–activity curve (AUCliver) was reduced by 2.7-fold and AUCliver/AUCplasma was reduced by 14-fold compared with baseline. PET image courtesy of N. Tournier, CEA, Service Hospitalier Frédéric Joliot, Orsay, France.
References
-
- Giacomini, K.M. & Sugiyama, Y. Membrane transporters and drug response. In Goodman & Gilman’s Pharmacological Basis of Therapeutics (eds. Brunton, L., Chabner, B. & Knollman, B.) 89–121 (McGraw-Hill, New York, 2011).
-
- Simonson, S.G. et al. Rosuvastatin pharmacokinetics in heart transplant recipients administered an antirejection regimen including cyclosporine. Clin. Pharmacol. Ther. 76, 167–177 (2004). - PubMed
-
- Neuvonen, P.J., Niemi, M. & Backman, J.T. Drug interactions with lipid-lowering drugs: mechanisms and clinical relevance. Clin. Pharmacol. Ther. 80, 565–581 (2006). - PubMed
-
- Tweedie, D. et al.; International Transporter Consortium. Transporter studies in drug development: experience to date and follow-up on decision trees from the International Transporter Consortium. Clin. Pharmacol. Ther. 94, 113–125 (2013). - PubMed
Publication types
MeSH terms
Substances
LinkOut - more resources
Full Text Sources
Other Literature Sources
Medical
