

Aptamer-targeted antigen delivery
- PMID: 24682172
- PMCID: PMC4089008
- DOI: 10.1038/mt.2014.51
Aptamer-targeted antigen delivery
Abstract
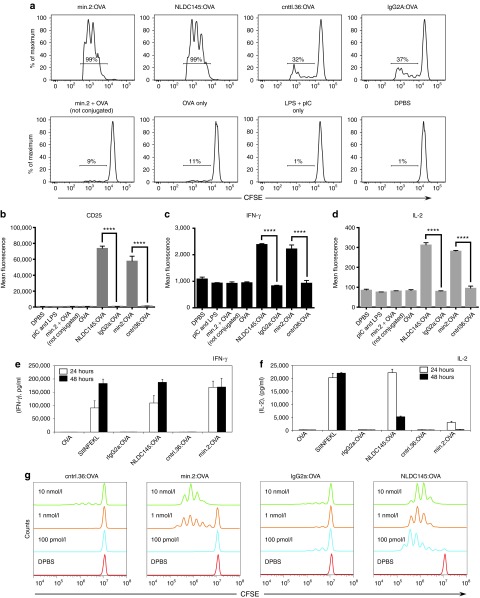
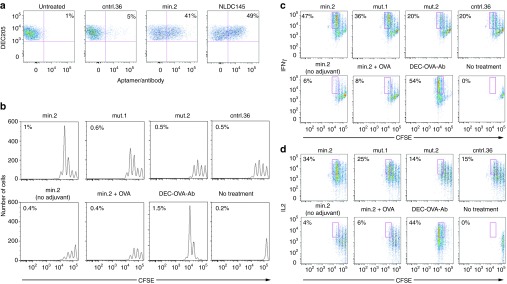
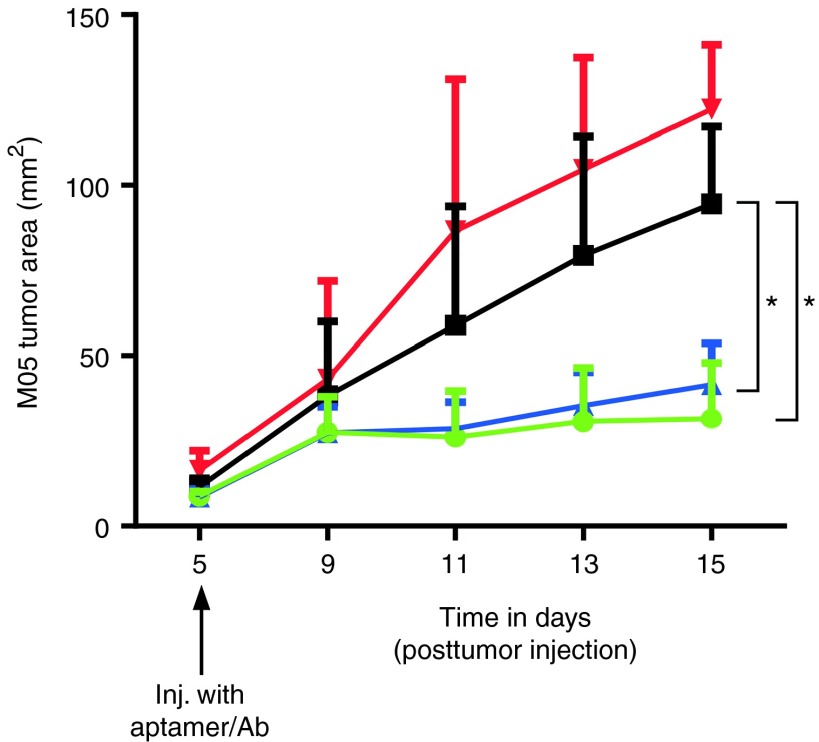
Effective therapeutic vaccines often require activation of T cell-mediated immunity. Robust T cell activation, including CD8 T cell responses, can be achieved using antibodies or antibody fragments to direct antigens of interest to professional antigen presenting cells. This approach represents an important advance in enhancing vaccine efficacy. Nucleic acid aptamers present a promising alternative to protein-based targeting approaches. We have selected aptamers that specifically bind the murine receptor, DEC205, a C-type lectin expressed predominantly on the surface of CD8α(+) dendritic cells (DCs) that has been shown to be efficient at facilitating antigen crosspresentation and subsequent CD8(+) T cell activation. Using a minimized aptamer conjugated to the model antigen ovalbumin (OVA), DEC205-targeted antigen crosspresentation was verified in vitro and in vivo by proliferation and cytokine production by primary murine CD8(+) T cells expressing a T cell receptor specific for the major histocompatibility complex (MHC) I-restricted OVA257-264 peptide SIINFEKL. Compared with a nonspecific ribonucleic acid (RNA) of similar length, DEC205 aptamer-OVA-mediated antigen delivery stimulated strong proliferation and production of interferon (IFN)-γ and interleukin (IL)-2. The immune responses elicited by aptamer-OVA conjugates were sufficient to inhibit the growth of established OVA-expressing B16 tumor cells. Our results demonstrate a new application of aptamer technology for the development of effective T cell-mediated vaccines.
Figures


Similar articles
-
Efficient targeting of protein antigen to the dendritic cell receptor DEC-205 in the steady state leads to antigen presentation on major histocompatibility complex class I products and peripheral CD8+ T cell tolerance.J Exp Med. 2002 Dec 16;196(12):1627-38. doi: 10.1084/jem.20021598. J Exp Med. 2002. PMID: 12486105 Free PMC article.
-
Selection of an antibody library identifies a pathway to induce immunity by targeting CD36 on steady-state CD8 alpha+ dendritic cells.J Immunol. 2008 Mar 1;180(5):3201-9. doi: 10.4049/jimmunol.180.5.3201. J Immunol. 2008. PMID: 18292544
-
Intradermal injections of polyarginine-containing immunogenic antigens preferentially elicit Tc1 and Th1 activation and antitumour immunity.Br J Dermatol. 2010 Jan;162(1):29-41. doi: 10.1111/j.1365-2133.2009.09490.x. Epub 2009 Oct 26. Br J Dermatol. 2010. PMID: 19863514
-
Antigen-Specific Stimulation of CD8+ T-cells by Murine Bone Marrow-Derived Dendritic Cells: Version 1.2019 Feb. In: National Cancer Institute’s Nanotechnology Characterization Laboratory Assay Cascade Protocols [Internet]. Bethesda (MD): National Cancer Institute (US); 2005 May 1–. NCL Method ITA-35. 2019 Feb. In: National Cancer Institute’s Nanotechnology Characterization Laboratory Assay Cascade Protocols [Internet]. Bethesda (MD): National Cancer Institute (US); 2005 May 1–. NCL Method ITA-35. PMID: 39013000 Free Books & Documents. Review.
-
Detection of Antigen Presentation by Murine Bone Marrow-Derived Dendritic Cells: Version 1.2019 Feb. In: National Cancer Institute’s Nanotechnology Characterization Laboratory Assay Cascade Protocols [Internet]. Bethesda (MD): National Cancer Institute (US); 2005 May 1–. NCL Method ITA-34. 2019 Feb. In: National Cancer Institute’s Nanotechnology Characterization Laboratory Assay Cascade Protocols [Internet]. Bethesda (MD): National Cancer Institute (US); 2005 May 1–. NCL Method ITA-34. PMID: 39012977 Free Books & Documents. Review.
Cited by
-
Aptamer Hybrid Nanocomplexes as Targeting Components for Antibiotic/Gene Delivery Systems and Diagnostics: A Review.Int J Nanomedicine. 2020 Jun 17;15:4237-4256. doi: 10.2147/IJN.S248736. eCollection 2020. Int J Nanomedicine. 2020. PMID: 32606675 Free PMC article. Review.
-
Cancer immunomodulation using bispecific aptamers.Mol Ther Nucleic Acids. 2022 Jan 10;27:894-915. doi: 10.1016/j.omtn.2022.01.008. eCollection 2022 Mar 8. Mol Ther Nucleic Acids. 2022. PMID: 35141049 Free PMC article. Review.
-
Targeting EGFR/HER2/HER3 with a Three-in-One Aptamer-siRNA Chimera Confers Superior Activity against HER2+ Breast Cancer.Mol Ther Nucleic Acids. 2018 Mar 2;10:317-330. doi: 10.1016/j.omtn.2017.12.015. Epub 2017 Dec 30. Mol Ther Nucleic Acids. 2018. PMID: 29499944 Free PMC article.
-
Aptamer-Mediated Delivery and Cell-Targeting Aptamers: Room for Improvement.Nucleic Acid Ther. 2018 Jun;28(3):194-199. doi: 10.1089/nat.2018.0732. Nucleic Acid Ther. 2018. PMID: 29883295 Free PMC article. Review.
-
Improved Synthesis and In Vitro Evaluation of an Aptamer Ribosomal Toxin Conjugate.Nucleic Acid Ther. 2016 Jun;26(3):156-65. doi: 10.1089/nat.2015.0599. Epub 2016 May 26. Nucleic Acid Ther. 2016. PMID: 27228412 Free PMC article.
References
-
- Steinman RM, Banchereau J. Taking dendritic cells into medicine. Nature. 2007;449:419–426. - PubMed
-
- D'Argenio DA, Wilson CB. A decade of vaccines: Integrating immunology and vaccinology for rational vaccine design. Immunity. 2010;33:437–440. - PubMed
-
- Dillman RO. Cancer immunotherapy. Cancer Biother Radiopharm. 2011;26:1–64. - PubMed
Publication types
MeSH terms
Substances
Grants and funding
LinkOut - more resources
Full Text Sources
Other Literature Sources
Research Materials
