. 2014 May 8;123(19):2988-96.
doi: 10.1182/blood-2013-07-517177. Epub 2014 Mar 28.

The genomic landscape of mantle cell lymphoma is related to the epigenetically determined chromatin state of normal B cells

Affiliations

The genomic landscape of mantle cell lymphoma is related to the epigenetically determined chromatin state of normal B cells

Jenny Zhang et al. Blood. .

Abstract

In this study, we define the genetic landscape of mantle cell lymphoma (MCL) through exome sequencing of 56 cases of MCL. We identified recurrent mutations in ATM, CCND1, MLL2, and TP53. We further identified a number of novel genes recurrently mutated in patients with MCL including RB1, WHSC1, POT1, and SMARCA4. We noted that MCLs have a distinct mutational profile compared with lymphomas from other B-cell stages. The ENCODE project has defined the chromatin structure of many cell types. However, a similar characterization of primary human mature B cells has been lacking. We defined, for the first time, the chromatin structure of primary human naïve, germinal center, and memory B cells through chromatin immunoprecipitation and sequencing for H3K4me1, H3K4me3, H3Ac, H3K36me3, H3K27me3, and PolII. We found that somatic mutations that occur more frequently in either MCLs or Burkitt lymphomas were associated with open chromatin in their respective B cells of origin, naïve B cells, and germinal center B cells. Our work thus elucidates the landscape of gene-coding mutations in MCL and the critical interplay between epigenetic alterations associated with B-cell differentiation and the acquisition of somatic mutations in cancer.


Figures
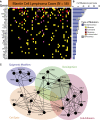
Figure 1
Figure 1
Exome sequencing in MCL reveals recurrently mutated genes. (A) The heatmap indicates the pattern of nonsynonymous mutations of the 37 most significantly implicated genes in 56 cases of MCL. Each column represents a patient, and each row represents a gene. Mutations are color-coded with yellow for a missense mutation, purple for a frameshift mutation, red for a nonsense mutation, and orange for an in-frame insertion or deletion. (B) The bar graph indicates the frequency of variants found by gene across all samples, subdivided by not-synonymous (blue) and synonymous (gray) mutations. (C) The network indicates functional groupings of the genes mutated in MCL. Nodes represent significantly mutated genes that are also a part of a significant functional group. Edges connect nodes that belong to the same functional gene set. Colored ovals identify the gene sets to which these nodes belong.
Figure 2
Figure 2
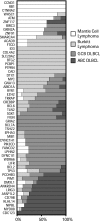
Patterns of exonic mutations across lymphomas show similarly and differentially mutated genes. The bar graph depicts the proportion of mutated cases that belong to each lymphoma type for MCL, BL, GCB DLBCL, and ABC DLBCL. ABC, activated B-cell like; GCB, germinal center B-cell like.
Figure 3
Figure 3
Differential gene expression of normal B cells correlates with B-cell chromatin profiles and gene expression of corresponding lymphomas. (A) Epigenetic profiles of H3K4me1, H3K4me3, H3K27 me3, H3Ac, H3K36me3, and PolII are shown in 50-bp read resolution from 2 kb upstream to 10 kb downstream of all annotated TSSs. (B) Epigenetic profiles of H3K4me1, H3K4me3, H3Ac, H3K36me3, and H3K27me3 around the TSSs are shown for the top 10% most expressed, bottom 10% expressed, and all genes for naïve and GC B cells.
Figure 4
Figure 4
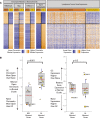
Open chromatin differences between B-cell differentiation stages associate with expression differences and mutation frequency in corresponding lymphomas. (A) The heatmap depicts the chromatin signal at gene level for H3K36me3, H3ac, and H3K4me1 open chromatin markers in genes with the most significant open chromatin differences between normal and GC B cells. On the rightmost heatmap, gene expression in MCL samples (64 cases) and BL (23 cases) is indicated for the same genes. Orange indicates higher chromatin signal or higher gene expression, and blue indicates lower. (B) The boxplots on the left illustrate difference in open chromatin score for genes differentially mutated between BL and MCL. On the horizontal axis, “MCL Mutated Genes” is defined as genes with a significantly higher mutation rate in MCL compared with BL (and the reverse for “BL Mutated Genes”). The boxplots on the right indicate expression fold change between normal GC and naïve B cells for the same 2 sets of genes. The size of the individual data points is scaled to the number of mutated cases in the corresponding disease.

References

    1. Swerdlow SH, Campo E, Harris NL, et al. 4th ed. Lyon, France: IARC Press; 2008. WHO Classification of Tumours of Haematopoietic and Lymphoid Tissues.
    1. Kridel R, Meissner B, Rogic S, et al. Whole transcriptome sequencing reveals recurrent NOTCH1 mutations in mantle cell lymphoma. Blood. 2012;119(9):1963–1971. - PubMed
    1. Meissner B, Kridel R, Lim RS, et al. The E3 ubiquitin ligase UBR5 is recurrently mutated in mantle cell lymphoma. Blood. 2013;121(16):3161–3164. - PubMed
    1. Ciriello G, Miller ML, Aksoy BA, Senbabaoglu Y, Schultz N, Sander C. Emerging landscape of oncogenic signatures across human cancers. Nat Genet. 2013;45(10):1127–1133. - PMC - PubMed
    1. Morin RD, Mendez-Lago M, Mungall AJ, et al. Frequent mutation of histone-modifying genes in non-Hodgkin lymphoma. Nature. 2011;476(7360):298–303. - PMC - PubMed

Publication types

MeSH terms