. 2014 Jun;196(11):2067-76.
doi: 10.1128/JB.01471-14. Epub 2014 Mar 28.

Lowering GTP level increases survival of amino acid starvation but slows growth rate for Bacillus subtilis cells lacking (p)ppGpp

Affiliations

Lowering GTP level increases survival of amino acid starvation but slows growth rate for Bacillus subtilis cells lacking (p)ppGpp

Alycia N Bittner et al. J Bacteriol. 2014 Jun.

Abstract

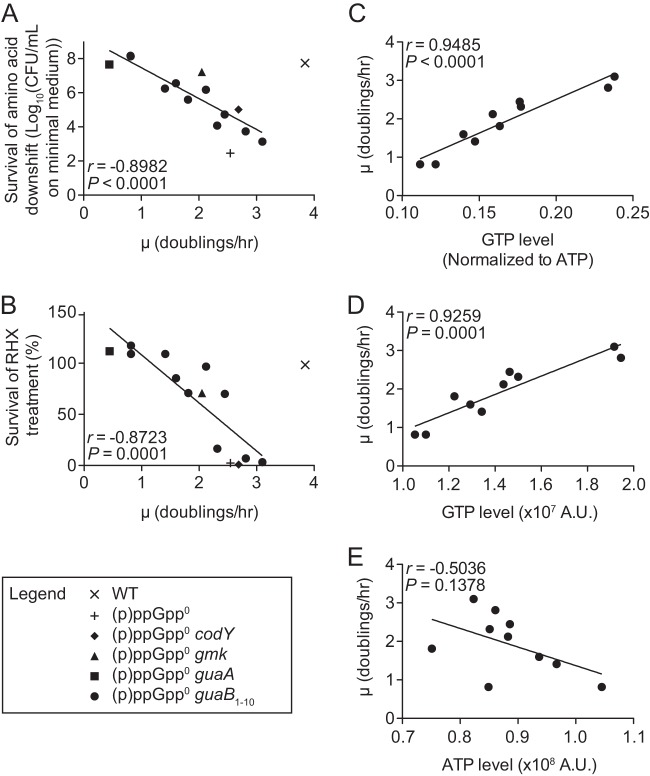
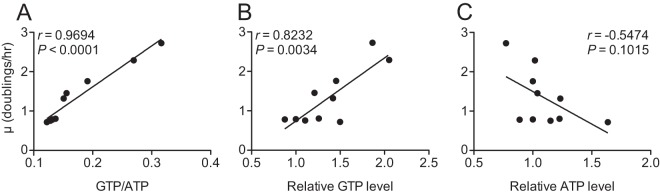
Bacterial cells sense external nutrient availability to regulate macromolecular synthesis and consequently their growth. In the Gram-positive bacterium Bacillus subtilis, the starvation-inducible nucleotide (p)ppGpp negatively regulates GTP levels, both to resist nutritional stress and to maintain GTP homeostasis during growth. Here, we quantitatively investigated the relationship between GTP level, survival of amino acid starvation, and growth rate when GTP synthesis is uncoupled from its major homeostatic regulator, (p)ppGpp. We analyzed growth and nucleotide levels in cells that lack (p)ppGpp and found that their survival of treatment with a nonfunctional amino acid analog negatively correlates with both growth rate and GTP level. Manipulation of GTP levels modulates the exponential growth rate of these cells in a positive dose-dependent manner, such that increasing the GTP level increases growth rate. However, accumulation of GTP levels above a threshold inhibits growth, suggesting a toxic effect. Strikingly, adenine counteracts GTP stress by preventing GTP accumulation in cells lacking (p)ppGpp. Our results emphasize the importance of maintaining appropriate levels of GTP to maximize growth: cells can survive amino acid starvation by decreasing GTP level, which comes at a cost to growth, while (p)ppGpp enables rapid adjustment to nutritional stress by adjusting GTP level, thus maximizing fitness.


Figures

FIG 1
FIG 1
Diagram of the de novo and salvage GTP biosynthesis pathways in B. subtilis. GTP is synthesized through the de novo pathway (blue) or the salvage pathway from guanosine (GUO) or guanine (GUA) (purple). Steps common to both pathways are in green. Enzymes that are inhibited by (p)ppGpp are underlined. The de novo enzyme GuaB is moderately inhibited by (p)ppGpp, while the salvage enzyme HprT is strongly inhibited. Gmk participates in both pathways and is strongly inhibited by (p)ppGpp. GTP level affects survival of amino acid starvation, including amino acid downshift and survival of arginine hydroxamate (RHX) treatment, and cell growth.
FIG 2
FIG 2
Growth rate of (p)ppGpp0 suppressor mutant cells negatively correlates with survival of amino acid downshift and survival of RHX treatment and positively correlates with GTP level. Pearson correlations of growth rate (μ) with survival of amino acid downshift (log10 of plating efficiency on minimal medium) (A) and survival of RHX treatment (% survival) (B) for (p)ppGpp0 suppressor mutants are shown (see Table 1 for suppressor mutant alleles). Wild-type and (p)ppGpp0 values are plotted for comparison. Values for survival of amino acid downshift (A) and RHX survival (B) are from the work of Kriel et al. (9). For amino acid downshift, cells were grown in CAA medium, harvested during log phase, washed, and plated on minimal medium. For RHX treatment, cells were grown in CAA medium, treated with RHX for 20 min, and plated for enumeration of CFU. (C to E) Pearson correlation of growth rate with GTP/ATP ratio (C), GTP level (D), and ATP level (E) for (p)ppGpp0 guaB suppressor mutants. Average GTP/ATP ratios (n = 4) and nucleotide levels (n = 2) are plotted. Arbitrary units (A.U.) are determined from the phosphorimager counts normalized to cell density (OD600). All growth rates were calculated from growth curves in low-phosphate CAA medium. Error for growth rates and GTP/ATP ratios for all suppressor mutants is shown in Fig. S1. Strains are YB886 (wild type), JDW755 [(p)ppGpp0], AK6 [(p)ppGpp0 codY], WZ11 [(p)ppGpp0 gmk], AK1 [(p)ppGpp0 guaA], AK22, AK14, AK2, WZ7, AK9, AK31, WZ8, WZ9, AK11, and WZ1 [(p)ppGpp0 guaB1 through (p)ppGpp0 guaB10].
FIG 3
FIG 3
Guanosine modulates growth of the (p)ppGpp0 guaB1 strain in LB medium. (A) Average and standard deviation of three growth curves for AK22 [(p)ppGpp0 guaB1] in LB medium supplemented with the indicated concentrations of GUO. (B and C) Average growth rates in LB for the (p)ppGpp0 guaB1 strain (B) and the (p)ppGpp0 gmk suppressor mutant (WZ11) (C). Error bars indicate standard deviations (n ≥ 6).
FIG 4
FIG 4
Guanosine inhibits growth of (p)ppGpp0 guaB1 cells in CAA medium. (A) Representative growth curve from three independent experiments. (p)ppGpp0 guaB1 (AK22) cells were grown in CAA medium supplemented with the indicated concentrations of GUO. (B) Average growth rates for (p)ppGpp0 guaB1 cells in CAA medium supplemented with GUO. Error bars indicate standard deviations (n ≥ 9). (C and D) (p)ppGpp+ cells containing a guaB depletion construct (JDW1397) grow at the same rate regardless of GUO concentration in CAA medium. (C) Representative growth curve of (p)ppGpp+ guaBdown (Pspac-guaB) cells in CAA medium supplemented with GUO (n ≥ 5). (D) Average growth rates of (p)ppGpp+ guaBdown cells in CAA medium supplemented with GUO. As a control for maximal growth rate when guaB is induced, cells were also grown in the same medium (without GUO) with 0.5 mM IPTG. Error bars indicate standard deviations (n ≥ 5). A comparison of growth rate and GTP level for (p)ppGpp+ guaBdown cells is shown in Fig. S1 in the supplemental material.
FIG 5
FIG 5
Adenine prevents GTP accumulation in (p)ppGpp0 cells and restores growth in the presence of guanosine. (A) GTP/ATP ratio, (B) change in GTP level (normalized to time zero [T0]), and (C) change in ATP level (normalized to T0) in wild-type, (p)ppGpp0, and (p)ppGpp0 guaB1 cells treated with GUO and adenine (ADE). Cells were grown in low-phosphate CAA medium, sampled (T0), and then treated for 20 min with 1 mM GUO/ADE or an equivalent volume of dimethyl sulfoxide (DMSO; control). DMSO is the solvent for ADE. Nucleotide levels were quantified by TLC. Error bars indicate ranges (n = 2). Growth of wild-type (D), (p)ppGpp0 (E), and (p)ppGpp0 guaB1 (F) cells upon treatment with 1 mM GUO/ADE or DMSO (control) is shown. Cells were grown to early log phase and then treated. Addition of GUO and/or ADE is indicated with an arrow. One representative growth curve from two replicates is shown. Strains are YB886 (the wild type), JDW755 [(p)ppGpp0] and AK22 [(p)ppGpp0 guaB1].
FIG 6
FIG 6
Manipulation of GTP/ATP ratio or GTP level in (p)ppGpp0 guaB1 (AK22) cells alters growth rate. Growth rate is positively correlated with GTP/ATP ratio (A) and GTP level (B) when nucleotide level is modulated by ADE and GUO concentration in CAA medium. (C) ATP level is not correlated with growth rate. GTP and ATP levels are relative to the control in medium lacking GUO or ADE. Values are Pearson correlation (r) and P value. Average values are plotted for growth rate (n ≥ 6) and nucleotide levels (n = 2 for most conditions). Details on ADE and GUO concentrations, with averages and error for all measurements, are in Fig. S4 in the supplemental material.
FIG 7
FIG 7
Guanosine modulates growth of (p)ppGpp0 guaB1 ΔcodY cells in LB medium. (A) Averages and standard deviations of three growth curves for the (p)ppGpp0 guaB1 ΔcodY mutant (JDW2208) in LB medium supplemented with the indicated concentrations of GUO. (B) Average growth rates in LB for the (p)ppGpp0 guaB1 ΔcodY mutant. Error bars indicate standard deviations (n ≥ 6).
FIG 8
FIG 8
Model of the quantitative relationship between GTP level and stress survival (dashed line) or growth (solid line) in the absence of (p)ppGpp.

References

    1. Bremer H, Dennis PP. 7 October 2008. Chapter 5.2.3, Modulation of chemical composition and other parameters of the cell at different exponential growth rates. In Böck A, Curtiss R, III, Kaper JB, Karp PD, Neidhardt FC, Nyström T, Slauch JM, Squires CL, Ussery D. (ed), EcoSal—Escherichia coli and Salmonella: cellular and molecular biology. ASM Press, Washington, DC. 10.1128/ecosal.5.2.4 - DOI - PubMed
    1. Dalebroux ZD, Swanson MS. 2012. ppGpp: magic beyond RNA polymerase. Nat. Rev. Microbiol. 10:203–212. 10.1038/nrmicro2720 - DOI - PubMed
    1. Potrykus K, Cashel M. 2008. (p)ppGpp: still magical? Annu. Rev. Microbiol. 62:35–51. 10.1146/annurev.micro.62.081307.162903 - DOI - PubMed
    1. Wendrich TM, Marahiel MA. 1997. Cloning and characterization of a relA/spoT homologue from Bacillus subtilis. Mol. Microbiol. 26:65–79. 10.1046/j.1365-2958.1997.5511919.x - DOI - PubMed
    1. Nanamiya H, Kasai K, Nozawa A, Yun CS, Narisawa T, Murakami K, Natori Y, Kawamura F, Tozawa Y. 2008. Identification and functional analysis of novel (p)ppGpp synthetase genes in Bacillus subtilis. Mol. Microbiol. 67:291–304. 10.1111/j.1365-2958.2007.06018.x - DOI - PubMed

Publication types

MeSH terms

LinkOut - more resources