. 2014 May;42(9):5937-48.
doi: 10.1093/nar/gku189. Epub 2014 Mar 20.

Distinct Z-DNA binding mode of a PKR-like protein kinase containing a Z-DNA binding domain (PKZ)

Affiliations

Distinct Z-DNA binding mode of a PKR-like protein kinase containing a Z-DNA binding domain (PKZ)

Doyoun Kim et al. Nucleic Acids Res. 2014 May.

Abstract

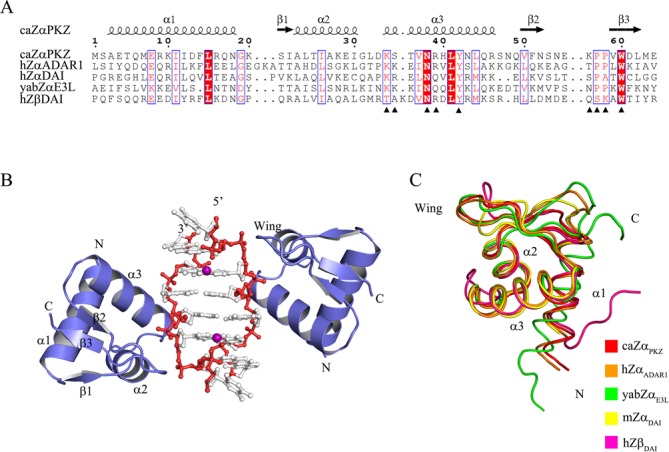
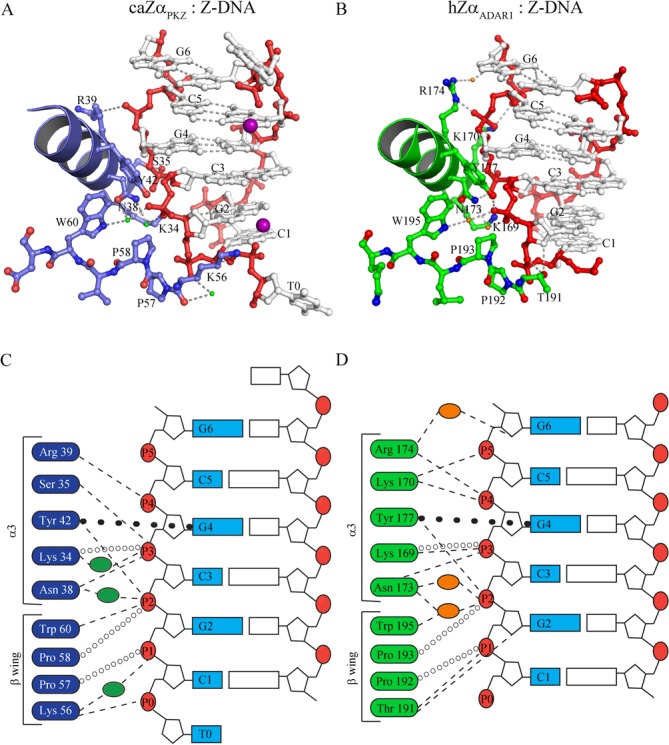
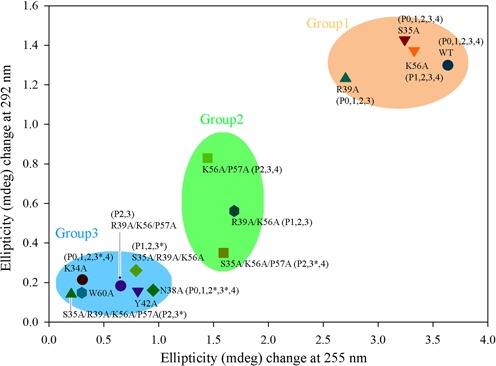
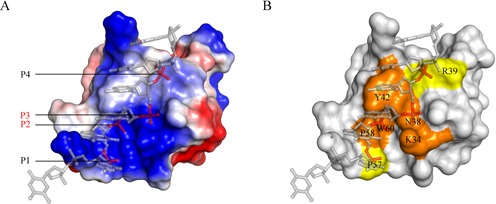
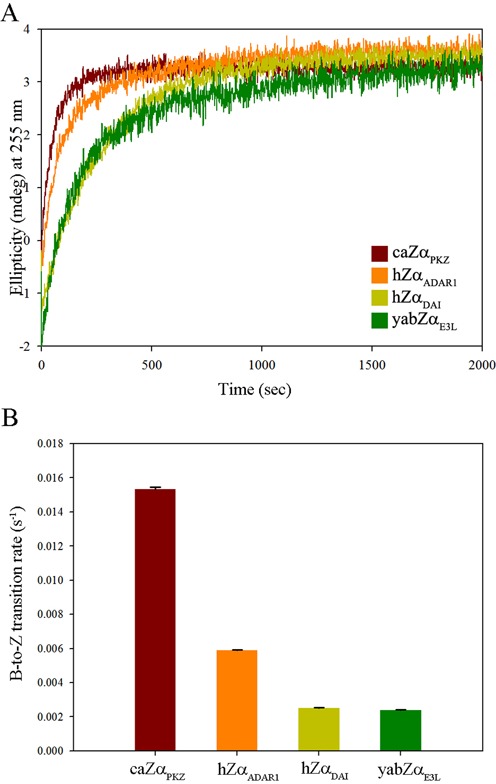
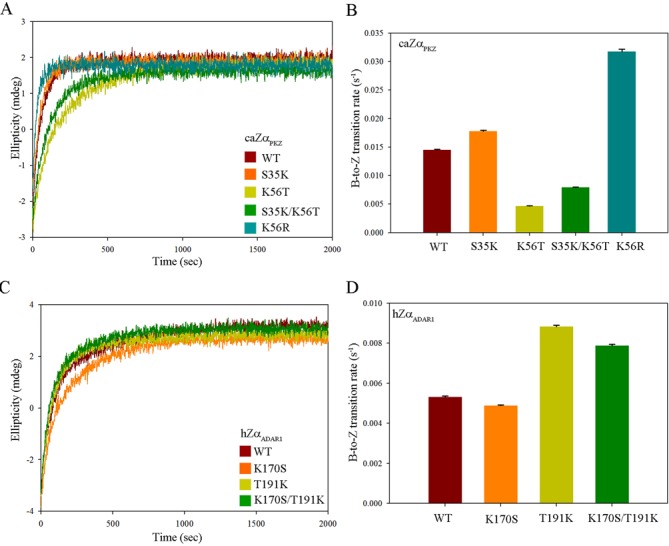
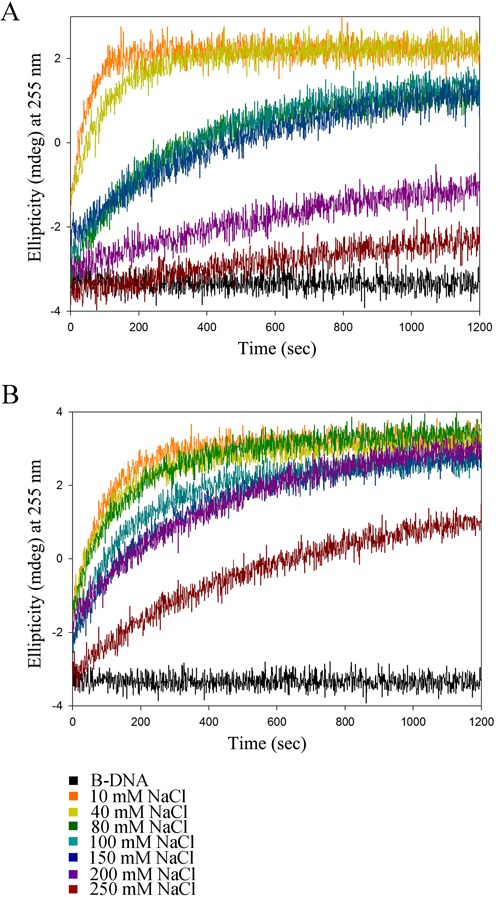
Double-stranded ribonucleic acid-activated protein kinase (PKR) downregulates translation as a defense mechanism against viral infection. In fish species, PKZ, a PKR-like protein kinase containing left-handed deoxyribonucleic acid (Z-DNA) binding domains, performs a similar role in the antiviral response. To understand the role of PKZ in Z-DNA recognition and innate immune response, we performed structural and functional studies of the Z-DNA binding domain (Zα) of PKZ from Carassius auratus (caZαPKZ). The 1.7-Å resolution crystal structure of caZαPKZ:Z-DNA revealed that caZαPKZ shares the overall fold with other Zα, but has discrete structural features that differentiate its DNA binding mode from others. Functional analyses of caZαPKZ and its mutants revealed that caZαPKZ mediates the fastest B-to-Z transition of DNA among Zα, and the minimal interaction for Z-DNA recognition is mediated by three backbone phosphates and six residues of caZαPKZ. Structure-based mutagenesis and B-to-Z transition assays confirmed that Lys56 located in the β-wing contributes to its fast B-to-Z transition kinetics. Investigation of the DNA binding kinetics of caZαPKZ further revealed that the B-to-Z transition rate is positively correlated with the association rate constant. Taking these results together, we conclude that the positive charge in the β-wing largely affects fast B-to-Z transition activity by enhancing the DNA binding rate.


Figures

Figure 1.
Figure 1.
Overall structure of caZαPKZ in complex with ds-dT(dCdG)3 and comparison with other Zα domains. (A) Sequence alignment of caZαPKZ with human ADAR1 (hZαADAR1), human DAI (hZαDAI) and yaba poxvirus E3L (yabZαE3L), and Zβ domain of human DAI (hZβDAI). The secondary structures of caZαPKZ are drawn at the top of the sequences. The residues interacting with the Z-DNA backbone are marked with filled triangles. (B) Overall structure of the caZαPKZ:Z-DNA complex. Double-stranded DNA and two Zα proteins are generated by C2 crystallographic symmetry. Proteins are colored slated blue, and backbones and bases of DNA are colored red and gray, respectively. The manganese ions are shown as purple spheres. (C) Structural comparisons of the Cα traces of caZαPKZ and other Zα domains. Protein structures of caZαPKZ, hZαADAR1 (PDB ID: 1QBJ), yabZαE3L (PDB ID: 1SFU), mZαDAI (PDB ID: 1J75) and hZβDAI (PDB ID: 3EYI) are drawn in red, orange, green, yellow and magenta, respectively.
Figure 2.
Figure 2.
The Z-DNA binding modes of caZαPKZ and hZαADAR1. (A) The binding interface between caZαPKZ and Z-DNA. The DNA binding interface of protein is depicted as a blue ribbon and ball-and-stick models. The residues involved in Z-DNA binding are labeled. The backbone and bases of DNA are drawn as red and gray ball-and-stick models. The manganese atoms are represented by magenta spheres. The water molecules are represented by green dots. (B) The Z-DNA binding interface of hZαADAR1. The DNA binding interface of protein is depicted by a green ribbon and ball-and-stick models. The residues involved in Z-DNA binding are labeled. The backbone and bases of DNA are drawn as red and gray ball-and-stick models. The water molecules are represented by orange dots. The schematic drawings of the DNA binding interfaces of caZαPKZ (C) and hZαADAR1 (D) with Z-DNA. The interaction residues of caZαPKZ and hZαADAR1 are represented in blue (C) and green boxes (D), respectively. The phosphate backbones are numbered from P0 to P5 in red circles. Hydrogen bonds, hydrophobic interactions and π–π interaction are represented by dashed lines, open circles and closed circles, respectively. Green (C) and orange (D) ovals stand for water molecules in the caZαPKZ and hZαADAR1 structures, respectively.
Figure 3.
Figure 3.
B-to-Z transition induced by caZαPKZ mutants. The Y-axis and X-axis display the ellipticity (mdeg) difference during B-to-Z transition at 292 nm and 255 nm, respectively. The wild-type, K34A, S35A, N38A, R39A, Y42A, K56A, W60A, R39A/K56A, S35A/R39A/K56A, K56A/P57A, S35A/K56A/P57A, R39A/K56A/P57A and S35A/R39A/K56A/P57A mutants of caZαPKZ were tested at a [P]/[N] ratio of 4. The plots are clustered in three groups by using k-means clustering algorithm. The names of phosphate groups inside of parentheses indicate the possible interaction between the residues in the mutants and the backbone phosphates. An asterisk indicates the phosphate groups that lose one of their residue interactions by mutation. In this case, their interactions with proteins partially remain.
Figure 4.
Figure 4.
The Z-DNA binding surface of caZαPKZ. (A) Electrostatic distribution of caZαPKZ. Positively charged, negatively charged and hydrophobic regions are depicted in blue, red and white, respectively. P2 and P3 are labeled in red, and P1 and P4 are in black. (B) The Z-DNA binding surface of caZαPKZ. Key residues involved in P2 and P3 binding are colored orange, and P1 or P4 binding residues are shown in yellow.
Figure 5.
Figure 5.
B-to-Z transition kinetics of Zα domains. (A) CD spectra of 15 μM of ds-(dCdG)6 were monitored at 255 nm in the presence of caZαPKZ (brown), hZαADAR1 (orange), hZαDAI (yellow) and yabZαE3L (green). (B) The calculated B-to-Z transition rates (s−1) with error bars from caZαPKZ (brown), hZαADAR1 (orange), hZαDAI (yellow) and yabZαE3L (green).
Figure 6.
Figure 6.
B-to-Z transition activity of caZαPKZ and hZαADAR1. (A) Time course CD spectra of caZαPKZ and S35K, K56T, K56R and S35K/K56T mutants. (B) The calculated B-to-Z transition rates (s−1) of the wild-type, S35K, K56T, S35K/K56T and K56R caZαPKZ are represented by brown, orange, lime, green and turquoise colors, respectively. (C) Time course CD spectra of hZαADAR1 and K170S, T191K and K170S/T191K mutants. (D) The calculated B-to-Z transition rates (s−1) of the wild-type, K170S, T191K and K170S/T191K mutant hZαADAR1 are represented by brown, orange, lime and green colors, respectively.
Figure 7.
Figure 7.
Salt effect on the B-to-Z transition. (A) Time course CD spectra of Z-DNA:caZαPKZ in various NaCl concentrations (10, 40, 80, 100, 150, 200 and 250 mM). The ellipticities (mdeg) monitored at 255 nm are indicated by different colors. (B) Time course CD spectra of Z-DNA:hZαADAR1 in the same conditions with the same color schemes as in Figure 7A.

References

    1. Holcik M., Sonenberg N. Translational control in stress and apoptosis. Nat. Rev. Mol. Cell Biol. 2005;6:318–327. - PubMed
    1. Samuel C.E. The eIF-2 alpha protein kinases, regulators of translation in eukaryotes from yeasts to humans. J. Biol. Chem. 1993;268:7603–7606. - PubMed
    1. Wek R.C., Jiang H.Y., Anthony T.G. Coping with stress: eIF2 kinases and translational control. Biochem. Soc. Trans. 2006;34:7–11. - PubMed
    1. Williams B.R. PKR: a sentinel kinase for cellular stress. Oncogene. 1999;18:6112–6120. - PubMed
    1. Wu S., Kaufman R.J. A model for the double-stranded RNA (dsRNA)-dependent dimerization and activation of the dsRNA-activated protein kinase PKR. J. Biol. Chem. 1997;272:1291–1296. - PubMed

Publication types

Associated data