. 2014 May 1;192(9):4134-44.
doi: 10.4049/jimmunol.1301859. Epub 2014 Mar 28.

Mechanistic target of rapamycin complex 1 expands Th17 and IL-4+ CD4-CD8- double-negative T cells and contracts regulatory T cells in systemic lupus erythematosus

Affiliations

Mechanistic target of rapamycin complex 1 expands Th17 and IL-4+ CD4-CD8- double-negative T cells and contracts regulatory T cells in systemic lupus erythematosus

Hiroshi Kato et al. J Immunol. .

Abstract

The mechanistic target of rapamycin (mTOR) is activated in CD4(-)CD8(-) double-negative (DN) T cells and its blockade is therapeutic in systemic lupus erythematosus (SLE) patients. Murine studies showed the involvement of mTOR complex 1 (mTORC1) and 2 (mTORC2) in the differentiation of Th1/Th17 cells and Th2 cells, respectively. In this study, we investigated the roles of mTORC1 and mTORC2 in T cell lineage development in SLE and matched healthy control (HC) subjects. mTORC1 activity was increased, whereas mTORC2 was reduced, as assessed by phosphorylation of their substrates phosphorylated S6 kinase 1 or phosphorylated S6 ribosomal protein and phosphorylated Akt, respectively. Rapamycin inhibited mTORC1 and enhanced mTORC2. IL-4 expression was increased in freshly isolated CD8(+) lupus T cells (SLE: 8.09 ± 1.93%, HC: 3.61 ± 0.49%; p = 0.01). DN T cells had greater IL-4 expression than CD4(+) or CD8(+) T cells of SLE patients after 3-d in vitro stimulation, which was suppressed by rapamycin (control: 9.26 ± 1.48%, rapamycin: 5.03 ± 0.66%; p < 0.001). GATA-3 expression was increased in CD8(+) lupus T cells (p < 0.01) and was insensitive to rapamycin treatment. IFN-γ expression was reduced in all lupus T cell subsets (p = 1.0 × 10(-5)) and also resisted rapamycin. IL-17 expression was increased in CD4(+) lupus T cells (SLE: 3.62 ± 0.66%, HC: 2.29 ± 0.27%; p = 0.019), which was suppressed by rapamycin (control: 3.91 ± 0.79%, rapamycin: 2.22 ± 0.60%; p < 0.001). Frequency of regulatory T cells (Tregs) was reduced in SLE (SLE: 1.83 ± 0.25%, HC: 2.97 ± 0.27%; p = 0.0012). Rapamycin inhibited mTORC1 in Tregs and promoted their expansion. Neutralization of IL-17, but not IL-4, also expanded Tregs in SLE and HC subjects. These results indicate that mTORC1 expands IL-4(+) DN T and Th17 cells, and contracts Tregs in SLE.


Conflict of interest statement

Disclosure

The authors have no financial conflicts of interest.

Figures
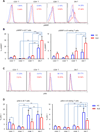
FIGURE 1
FIGURE 1. Increased mTORC1 and decreased mTORC2 activities in T cells of patients with SLE
Untouched T cells from HC and SLE patients were stained with CD4, CD8, anti-pS6RP and anti-pAkt antibodies immediately after isolation on day 0 (d0) and following 3-day incubation (d3). (A) Representative flow cytometry histograms of pS6RP staining. The numbers in the histograms denote the frequency of pS6RPhi cells in each T cell subset. The blue and red histograms and numbers represent data from HC and SLE donors, respectively. In the histogram of DN T cells, CD3+ T cells are overlaid as dotted lines. (B) The left panel shows cumulative data from 8 sets of patients and matched controls on day 0 (d0; ***, p=0.0029, †, p<0.001, ††, p=0.0004, †††, p<0.0001), while the right panel shows data after 3-day incubation (d3; *, p<0.05, **, p=0.0109, †, p<0.001). (C) Representative flow cytometry histograms of pAkt staining. The numbers in the histograms denote the frequency of pAkt+ cells in each T cell subset. The blue and red histograms and numbers represent data from HC and SLE subjects, respectively. (D) The left panel shows cumulative data from 9 sets of patients and matched controls on day 0 (d0: *, p=0.043, ***, p=0.019, ††, p<0.001), while the right panel shows data after 3-day incubation (d3: **, p=0.035, †, p<0.01, ††, p<0.001).
FIGURE 2
FIGURE 2. Rapamycin suppresses mTORC1 activity but augments mTORC2 activity in lupus and control T cells
Untouched T cells from HC and SLE donors were cultured for 3 days in the presence of anti-CD3/CD28 with (+) and without 100 nM rapamycin (−). After obtaining T cell lysates, immunoblotting was performed using anti-Akt, anti-pAkt, anti-S6K1, and anti-pS6K1. (A) Representative immunoblot staining. (B) Cumulative data from 5 sets of experiments are presented after normalizing the signal intensity to human β-actin (*, p=0.02, **, p=0.0096, ***, p=0.004, ****, p=0.002).
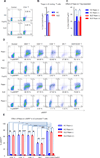
FIGURE 3
FIGURE 3. Increased IL-4 and IL-17 and reduced IFN-γ expression in freshly isolated lupus T cells
(A) Representative flow cytometry dot plots of IFN-γ versus IL-4 staining (upper panel) and IL-17 versus IL-4 staining in lupus T cells (lower panel). Control denotes staining with isotype control antibodies. (B) The left panel shows cumulative data of IL-4 expression from 18 sets of patients and matched controls (***, p=0.019, †, p=0.01, †††, p<0.001). The center panel shows cumulative data of IFN-γ expression from 15 sets of patients and matched controls (††, p=0.002, †††, p<0.001, ‡, p=3.1×10⁻⁵, ‡‡, p=1.0×10⁻⁵, ‡‡‡, p=3.6×10⁻⁶). The right panel shows cumulative data of IL-17 expression from 17 sets of patients and matched controls (*, p<0.05, **, p=0.043, ***, p=0.019, †††, p<0.001). Paired t-test was performed to compare patients and matched controls. Two-way ANOVA was performed to compare different T cell subsets.
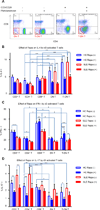
FIGURE 4
FIGURE 4. Rapamycin reverses the increased production of IL-4 and IL-17 by lupus T cells in a subset-specific manner following CD3/CD28 stimulation for 3 days
(A) Flow cytometry detection of DN and true DN T cells following incubation of untouched T cells for 3 days in the presence or absence of anti-CD3/CD28 and subsequent 6-h PMA/ionomycin treatment. (B) Cumulative data of IL-4 expression from 13 sets of patients and matched controls (*, p<0.05, **, p<0.01, ***, p<0.001). (C) Cumulative data of IFN-γ expression from 13 sets of patients and matched controls (*, p=0.037, **, p=0.035, ***, p=0.033, ****, p=0.001, †, p<0.001, ††, p=0.00026, †††, p=0.00017). (D) Cumulative data of IL-17 expression from 17 sets of patients and matched controls (*, p<0.05, **, p<0.01, ***, p<0.001). Two-way ANOVA was performed to compare different T cell subsets and to determine the impact of 100 nM in vitro rapamycin treatment on cytokine production.
FIGURE 5
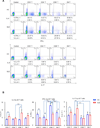
FIGURE 5. Increased expression of GATA-3 in CD8+ lupus T cells
Untouched T cells from HC and SLE donors were examined immediately after isolation on day 0 (d0) and following 3-day incubation in vitro (d3). (A) Representative flow cytometry histograms of GATA-3 staining on day 0. The numbers in the histograms denote the frequency of GATA-3+ cells in each T cell subset. The blue and red histograms and numbers represent data from HC and SLE donors, respectively. (B) The left panel shows cumulative data from 10 sets of patients and matched controls on day 0 (d0: **, p<0.01; ***, p<0.001), while the right panel shows cumulative data from 6 sets of patients and matched controls after 3-day culture (d3: *, p<0.05; **, p<0.01; ***, p<0.001). Data were analyzed by two-way ANOVA.
FIGURE 6
FIGURE 6. Rapamycin suppresses mTORC1 and promotes the expansion CD4+ CD25+FoxP3+ Tregs in untouched T cells from SLE and matched HC donors
(A) Representative flow cytometry of cells cultured for 3 days without CD3/CD28 stimulation. The numbers in the dot plots represent the frequency of CD4+CD25+FoxP3+ T cells. Control denotes staining with isotype control antibodies. (B) Depletion of Tregs among untouched T cells of SLE patients. Cumulative data from 17 sets of patients and matched controls were analyzed with paired t-test (***, p=0.0012). (C) Expansion of Tregs by rapamycin in vitro. Untouched T cells from SLE and matched HC donors were cultured for 3 days in the presence of anti-CD3/CD28 with or without 100 nM rapamycin. Cumulative data from 19 sets of patients and matched HC donors were analyzed by paired t-test (‡, p=1.7×10⁻⁷). (D) Representative detection of pS6RP in T cell subsets by flow cytometry. Control denotes staining with isotype control antibodies. (E) Effect of rapamycin on mTORC1 measured by pS6RP expression in T-cell subsets. Data show cumulative analysis of 23 sets of patients and matched controls using paired t-test (*, p=0.023; **, p=0.012; ***, p=0.0088; ****, p=0.0004; *****, p=0.00021; †, p=5.5×10⁻⁵; ††, p=2.1×10⁻¹¹; †††, p=1.3×10⁻¹¹; ††††, p=4.8×10⁻¹²; †††††, p=7.3×10⁻¹³; ‡, p=1.5×10⁻¹³; ‡‡, p=2.9×10⁻¹⁵; ‡‡‡, p=2.9×10⁻¹⁶; ‡‡‡‡, p=9.0×10⁻¹⁷; ‡‡‡‡‡, p=6.8×10⁻¹⁷; §, p=1.6×10⁻¹⁷; §§, p=3.7×10⁻¹⁸; §§§, p=1.8×10⁻¹⁸).
FIGURE 7
FIGURE 7. IL-17 restrains CD4+CD25+FoxP3+ Treg expansion
Untouched T cells from matched HC and SLE donors were stimulated with anti-CD3/CD28 for 3 days in the absence or presence of IL-4 (100 ng/ml), anti-IL-4 (5 µg/ml), IL-17 (10 ng/ml), anti-IL-17 (10 µg/ml), or rapamycin (100 nM). (A) Representative flow cytometry dot plots. (B) Cumulative data from 6 sets of patients and matched HC donors analyzed by two-way ANOVA (*, p<0.05, ***, p<0.001). Control denotes stimulation with anti-CD3/CD28 without exogenous cytokine, cytokine-neutralizing antibodies, or rapamycin.
FIGURE 8
FIGURE 8. Blockade of mTORC1 but not GATA-3 by rapamycin reverses pro-inflammatory cytokine imbalance in lupus T cells
Production of IL-4 and IL-17 is increased in DN and CD4+ T cells, respectively, in an mTORC1-dependent manner. Lupus CD8+ T cells produce IL-4 in an mTORC1-independent but GATA-3 dependent manner. Depletion of CD4+CD25+FoxP3+ Tregs is reversed by rapamycin through direct blockade of mTORC1. Increased production of IL-17 may indirectly restrain Tregs. IFN-γ is reduced in SLE, which is mTORC1 independent. The components highlighted in red and blue denote increases and decreases in SLE, respectively. The green arrows denote the corrective effects of rapamycin.

Similar articles

Cited by

References

    1. Shivakumar S, Tsokos GC, Datta SK. T cell receptor alpha/beta expressing double-negative (CD4−/CD8−) and CD4+ T helper cells in humans augment the production of pathogenic anti-DNA autoantibodies associated with lupus nephritis. J Immunol. 1989;143:103–112. - PubMed
    1. Takeuchi T, Abe T, Koide J, Hosono O, Morimoto C, Homma M. Cellular mechanism of DNA-specific antibody synthesis by lymphocytes from systemic lupus erythematosus patients. Arthritis Rheum. 1984;27:766–773. - PubMed
    1. Sieling PA, Porcelli SA, Duong BT, Spada F, Bloom BR, Diamond B, Hahn BH. Human double-negative T cells in systemic lupus erythematosus provide help for IgG and are restricted by CD1c. J Immunol. 2000;165:5338–5344. - PubMed
    1. Anand A, Dean GS, Quereshi K, Isenberg DA, Lydyard PM. Characterization of CD3+ CD4− CD8− (double negative) T cells in patients with systemic lupus erythematosus: activation markers. Lupus. 2002;11:493–500. - PubMed
    1. Rajagopalan S, Zordan T, Tsokos GC, Datta SK. Pathogenic anti-DNA autoantibody-inducing T helper cell lines from patients with active lupus nephritis: isolation of CD4-8- T helper cell lines that express the gamma delta T-cell antigen receptor. Proc Natl Acad Sci U S A. 1990;87:7020–7024. - PMC - PubMed

Publication types

MeSH terms

Substances