. 2014 Mar 26:3.
doi: 10.3402/jev.v3.23743. eCollection 2014.

Exosomes provide a protective and enriched source of miRNA for biomarker profiling compared to intracellular and cell-free blood

Affiliations

Exosomes provide a protective and enriched source of miRNA for biomarker profiling compared to intracellular and cell-free blood

Lesley Cheng et al. J Extracell Vesicles. .

Abstract

Introduction: microRNA (miRNA) are small non-coding RNA species that are transcriptionally processed in the host cell and released extracellularly into the bloodstream. Normally involved in post-transcriptional gene silencing, the deregulation of miRNA has been shown to influence pathogenesis of a number of diseases.

Background: Next-generation deep sequencing (NGS) has provided the ability to profile miRNA in biological fluids making this approach a viable screening tool to detect miRNA biomarkers. However, collection and handling procedures of blood needs to be greatly improved for miRNA analysis in order to reliably detect differences between healthy and disease patients. Furthermore, ribonucleases present in blood can degrade RNA upon collection rendering extracellular miRNA at risk of degradation. These factors have consequently decreased sensitivity and specificity of miRNA biomarker assays.

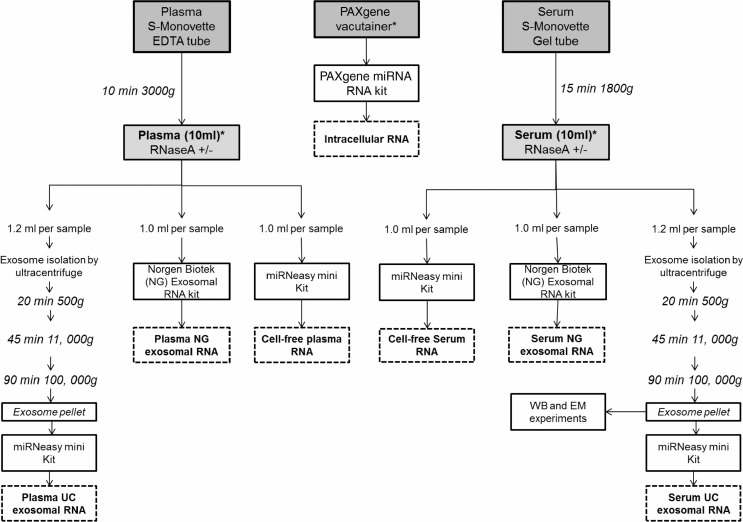
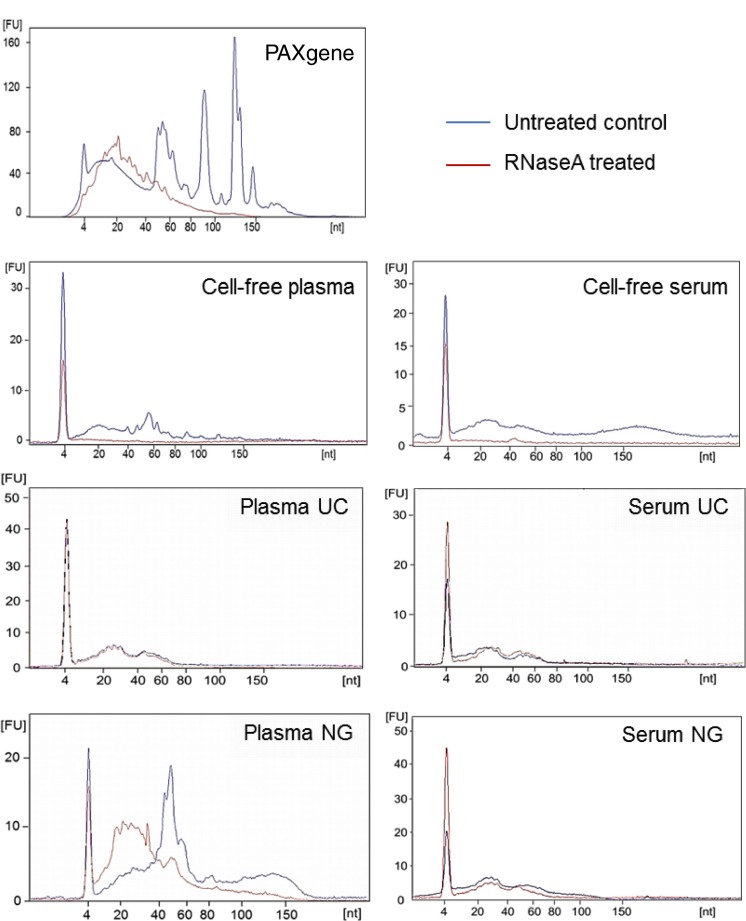
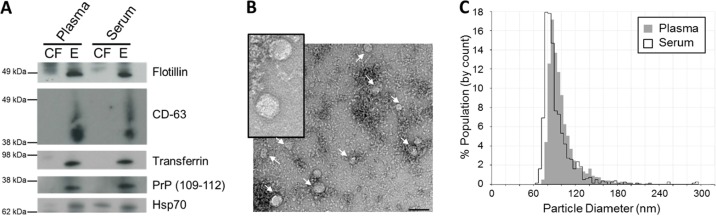
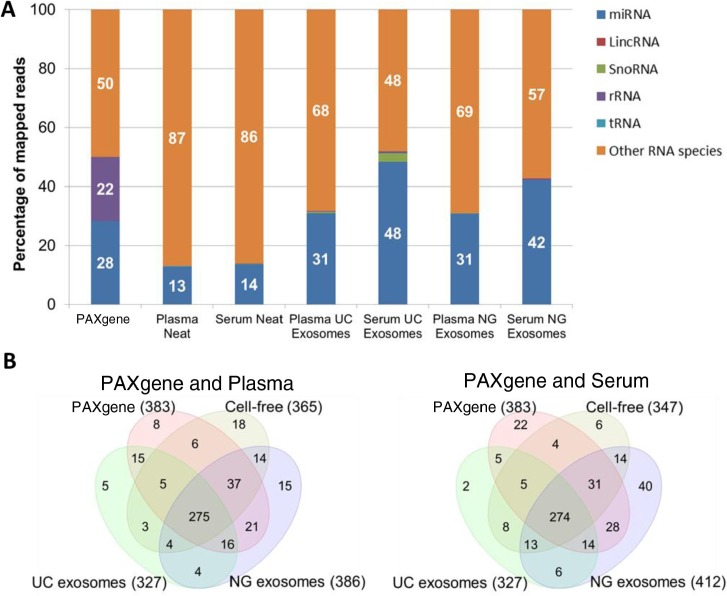
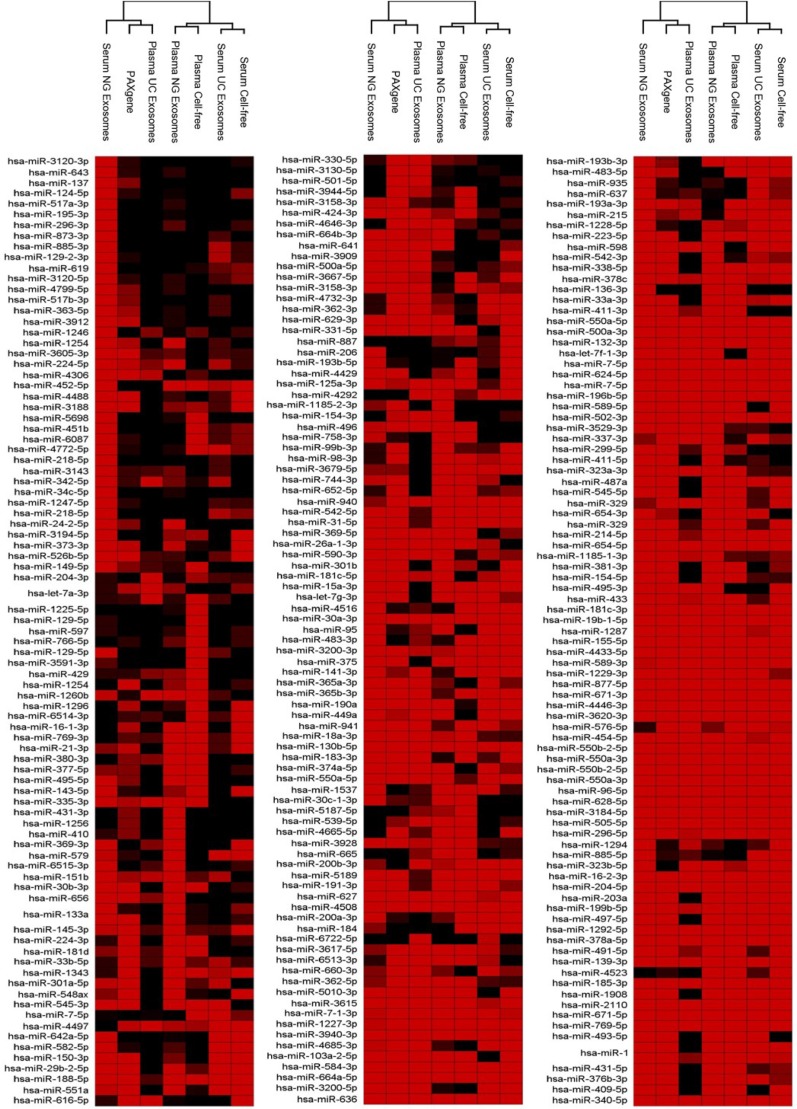
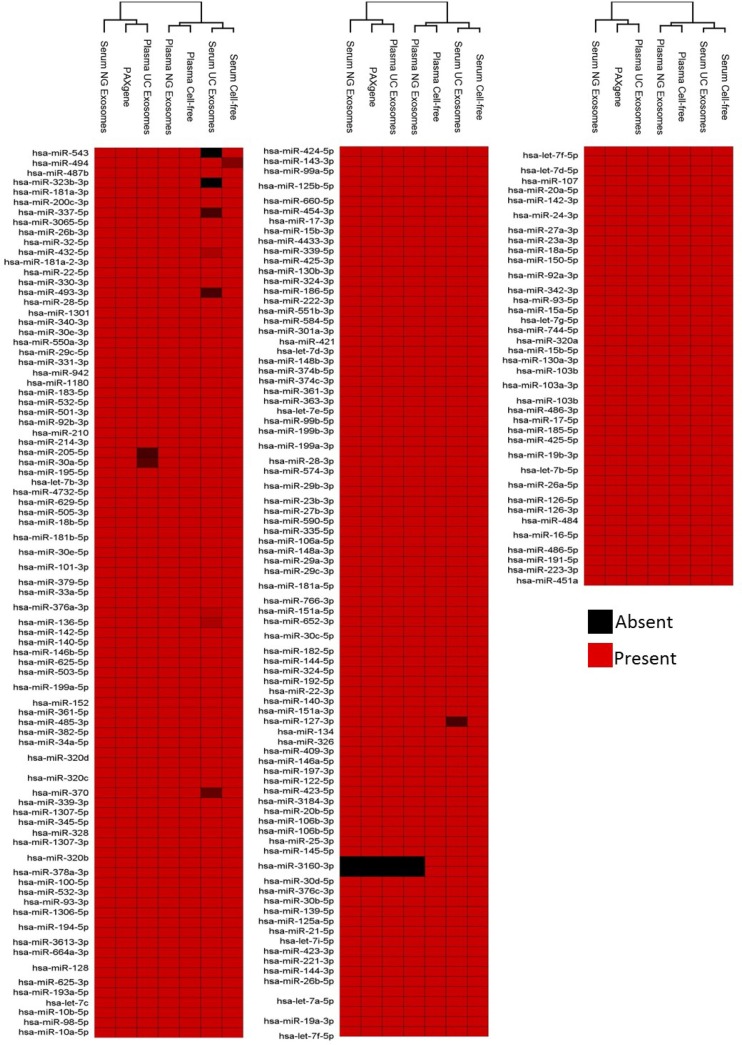
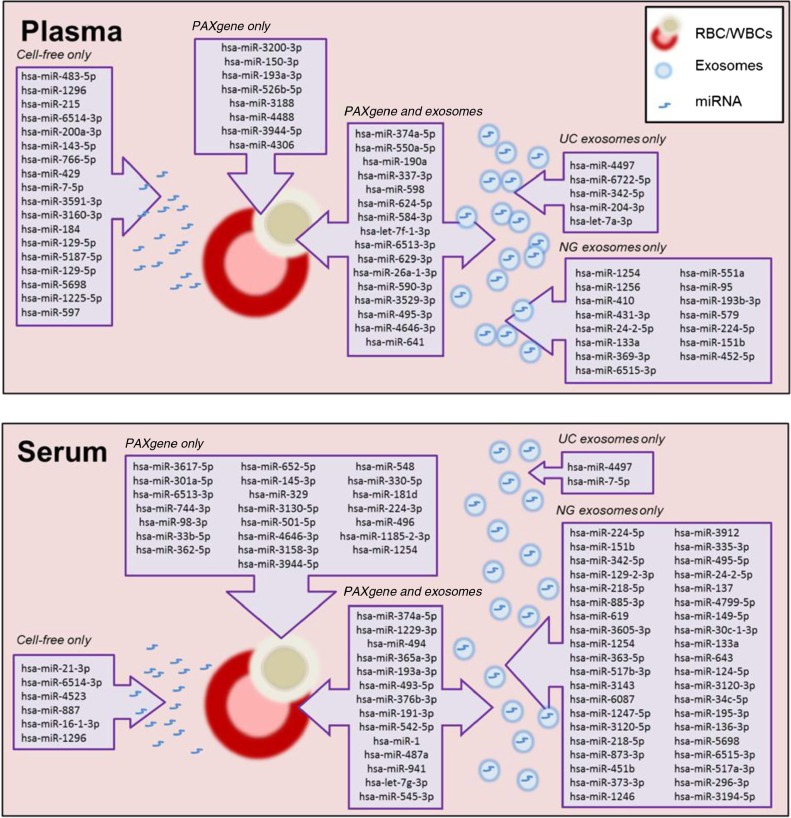
Methods: Here, we use NGS to profile miRNA in various blood components and identify differences in profiles within peripheral blood compared to cell-free plasma or serum and extracellular vesicles known as exosomes. We also analyse and compare the miRNA content in exosomes prepared by ultracentrifugation methods and commercial exosome isolation kits including treating samples with RNaseA.

Conclusion: This study demonstrates that exosomal RNA is protected by RNaseA treatment and that exosomes provide a consistent source of miRNA for disease biomarker detection.

Keywords: deep sequencing; exosomes; microRNA; plasma; serum.


Figures

Fig. 1
Fig. 1
Work flow of study design and sample processing. Whole blood from 3 different individuals was collected by venepuncture into each tube using a Multi-fly and processed to analyse intracellular, cell-free and exosomal miRNA. Asterisks indicate the point of RNaseA treatment (100 ng/ml, 37°C for 10 minutes) to investigate RNA degradation in these samples. The workflow outlines the sample collection and preparation from 1 individual. The number of tubes collected from each volunteer was: 2×PAXgene 2.5 ml tubes, 3×Sarstedt S-Monovette serum-gel 7.5 ml tubes and 3×Sarstedt S-Monovette EDTA 7.5 ml tubes. Upon centrifugation of the Sarstedt S-Monovette EDTA tubes, approximately 10 ml of plasma was obtained across 3 Sarstedt S-Monovette tubes which are then separately aliquoted into Lo-Bind DNA tubes (4×1 ml, 2×1.2 ml tubes) for RNA analysis and deep sequencing. The remaining plasma was aliquoted for Western immunoblotting (WB, 1.2 ml), transmission electron microscopy (EM, 1.2 ml) and qNano (1 ml) analysis. For the RNA work involving RNaseA treatment, samples were allocated for an untreated control and RNaseA treatment: 2×1.2 ml for the ultracentrifugation exosomal RNA isolation (Plasma UC), 2×1 ml for the Norgen Biotek exosomal RNA isolation (Plasma NG), and 2×1 ml aliquot was reserved for cell-free plasma RNA isolation. The collection process and sample allocation are repeated for serum collection. Exosomes isolated from serum via the ultracentrifuge are denoted as Serum UC. Exosomal RNA isolated by the Norgen Biotek Kit are denoted as Serum NG. As for the 2×PAXgene tubes, RNA is isolated from 2.5 ml of whole blood per tube and isolated as recommended by the manufacturers protocol. One tube was treated with RNaseA and one was left untreated.
Fig. 2
Fig. 2
Small RNA profiles extracted from intracellular, cell-free and exosomal isolation from blood before and after RNaseA treatment. RNA was extracted from samples and run on a Small RNA Bioanalyser assay. Experiments shown here are representative of samples collected from 1 volunteer.
Fig. 3
Fig. 3
Characterization of plasma and serum exosomes isolated by differential ultracentrifugation. (A) Western immunoblotting of exosomal markers flotillin, CD-63, transferrin, PrP (109–112) and Hsp70 in cell-free (CF) and exosomal (E) samples in plasma and serum. (B) Plasma and serum exosomes were analysed under electron microscopy which displayed the same morphology. Plasma exosomes are shown here. Insert is a larger magnification of the exosomal vesicles. Bar = 100 nm (C) Size distribution of exosomes analysed by the qNano particle counter. Experiments shown here are representative of samples collected from 1 volunteer.
Fig. 4
Fig. 4
Percentage and number of known miRNA species detected in intracellular, cell-free and exosomal samples by NGS. Raw reads were aligned to the human genome (HG19) and mapped to miRBase V.20 and other small RNA from Ensembl Release 74 followed by normalization of raw reads to RPM. The mean of reads per miRNA (n=3) was calculated. A) Percentage of total reads mapped to non-coding small RNA and other RNA species identified by deep sequencing. B) Venn diagrams showing unique and common miRNA detected in different components of blood. miRNA with read counts >5 reads per million were shown for comparison. miRNA identified in this study was uploaded to http://www.microvesicles.org (17).
Fig. 5
Fig. 5
Presence and absence of the highly abundant miRNAs identified across intracellular blood, cell-free samples and exosomes samples. Raw reads were aligned to the human genome (HG19) and mapped to miRBase V.20 followed by normalization of raw reads to RPM. The mean was calculated across 3 volunteer samples. miRNA with read counts >5 reads per million were shown for comparison. Hierarchical clustering was performed across samples and miRNA. Data has been uploaded to http://microvesicles.org/.
Fig. 5
Fig. 5
Presence and absence of the highly abundant miRNAs identified across intracellular blood, cell-free samples and exosomes samples. Raw reads were aligned to the human genome (HG19) and mapped to miRBase V.20 followed by normalization of raw reads to RPM. The mean was calculated across 3 volunteer samples. miRNA with read counts >5 reads per million were shown for comparison. Hierarchical clustering was performed across samples and miRNA. Data has been uploaded to http://microvesicles.org/.
Fig. 6
Fig. 6
Schematic summary of unique miRNA detected in intracellular, cell-free and exosomal samples prepared from plasma and serum.

References

    1. Griffiths-Jones S. The microRNA registry. Nucleic Acids Res. 2004;32:D109–11. - PMC - PubMed
    1. Croce CM, Calin GA. miRNAs, cancer, and stem cell division. Cell. 2005;122:6–7. - PubMed
    1. Arroyo JD, Chevillet JR, Kroh EM, Ruf IK, Pritchard CC, Gibson DF, et al. Argonaute2 complexes carry a population of circulating microRNAs independent of vesicles in human plasma. Proc Natl Acad Sci U S A. 2011;108:5003–8. - PMC - PubMed
    1. Valadi H, Ekstrom K, Bossios A, Sjostrand M, Lee JJ, Lotvall JO. Exosome-mediated transfer of mRNAs and microRNAs is a novel mechanism of genetic exchange between cells. Nat Cell Biol. 2007;9:654–9. - PubMed
    1. Schipper H, Maes O, Chertkow H, Wang E. MicroRNA expression in Alzheimer blood mononuclear cells. Gene Regul Syst Bio. 2007;1:263–74. - PMC - PubMed