

Sexual dimorphism in offspring glucose-sensitive hypothalamic gene expression and physiological responses to maternal high-fat diet feeding
- PMID: 24684305
- PMCID: PMC4183922
- DOI: 10.1210/en.2014-1131
Sexual dimorphism in offspring glucose-sensitive hypothalamic gene expression and physiological responses to maternal high-fat diet feeding
Abstract
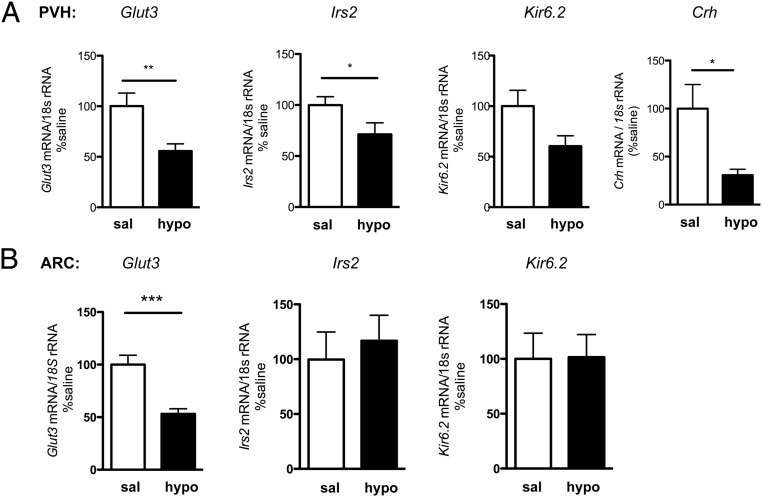
A wealth of animal and human studies demonstrate that early life environment significantly influences adult metabolic balance, however the etiology for offspring metabolic misprogramming remains incompletely understood. Here, we determine the effect of maternal diet per se on offspring sex-specific outcomes in metabolic health and hypothalamic transcriptome regulation in mice. Furthermore, to define developmental periods of maternal diet misprogramming aspects of offspring metabolic balance, we investigated offspring physiological and transcriptomic consequences of maternal high-fat/high-sugar diet feeding during pregnancy and/or lactation. We demonstrate that female offspring of high-fat/high-sugar diet-fed dams are particularly vulnerable to metabolic perturbation with body weight increases due to postnatal processes, whereas in utero effects of the diet ultimately lead to glucose homeostasis dysregulation. Furthermore, glucose- and maternal-diet sensitive gene expression modulation in the paraventricular hypothalamus is strikingly sexually dimorphic. In summary, we uncover female-specific, maternal diet-mediated in utero misprogramming of offspring glucose homeostasis and a striking sexual dimorphism in glucose- and maternal diet-sensitive paraventricular hypothalamus gene expression adjustment. Notably, female offspring metabolic vulnerability to maternal high-fat/high-sugar diet propagates a vicious cycle of obesity and type 2 diabetes in subsequent generations.
Figures


Similar articles
-
Maternal and postweaning diet interaction alters hypothalamic gene expression and modulates response to a high-fat diet in male offspring.Am J Physiol Regul Integr Comp Physiol. 2009 Oct;297(4):R1049-57. doi: 10.1152/ajpregu.90585.2008. Epub 2009 Aug 5. Am J Physiol Regul Integr Comp Physiol. 2009. PMID: 19657097
-
Maternal and post-weaning high-fat, high-sucrose diet modulates glucose homeostasis and hypothalamic POMC promoter methylation in mouse offspring.Metab Brain Dis. 2015 Oct;30(5):1129-37. doi: 10.1007/s11011-015-9678-9. Epub 2015 May 5. Metab Brain Dis. 2015. PMID: 25936720
-
Female and male C57BL/6J offspring exposed to maternal obesogenic diet develop altered hypothalamic energy metabolism in adulthood.Am J Physiol Endocrinol Metab. 2022 Nov 1;323(5):E448-E466. doi: 10.1152/ajpendo.00100.2022. Epub 2022 Sep 21. Am J Physiol Endocrinol Metab. 2022. PMID: 36342228 Free PMC article.
-
Metabolic and behavioural effects in offspring exposed to maternal sucrose consumption: a systematic review and meta-analysis of data from rodent models.J Dev Orig Health Dis. 2021 Aug;12(4):603-618. doi: 10.1017/S2040174420000823. Epub 2020 Sep 10. J Dev Orig Health Dis. 2021. PMID: 32907667
-
High-Fat Diet and Metabolic Diseases: A Comparative Analysis of Sex-Dependent Responses and Mechanisms.Int J Mol Sci. 2025 May 16;26(10):4777. doi: 10.3390/ijms26104777. Int J Mol Sci. 2025. PMID: 40429918 Free PMC article. Review.
Cited by
-
Maternal dietary fat during lactation shapes single nucleus transcriptomic profile of postnatal offspring hypothalamus in a sexually dimorphic manner in mice.Nat Commun. 2024 Mar 16;15(1):2382. doi: 10.1038/s41467-024-46589-x. Nat Commun. 2024. PMID: 38493217 Free PMC article.
-
Sex and gender differences in developmental programming of metabolism.Mol Metab. 2018 Sep;15:8-19. doi: 10.1016/j.molmet.2018.04.007. Epub 2018 Apr 30. Mol Metab. 2018. PMID: 29773464 Free PMC article. Review.
-
High Fat Programming and Cardiovascular Disease.Medicina (Kaunas). 2018 Nov 13;54(5):86. doi: 10.3390/medicina54050086. Medicina (Kaunas). 2018. PMID: 30428585 Free PMC article. Review.
-
Exposure to maternal obesity alters gene expression in the preimplantation ovine conceptus.BMC Genomics. 2018 Oct 11;19(1):737. doi: 10.1186/s12864-018-5120-0. BMC Genomics. 2018. PMID: 30305020 Free PMC article.
-
The Good, the Bad, and the Ugly of Pregnancy Nutrients and Developmental Programming of Adult Disease.Nutrients. 2019 Apr 20;11(4):894. doi: 10.3390/nu11040894. Nutrients. 2019. PMID: 31010060 Free PMC article. Review.
References
Publication types
MeSH terms
Substances
Grants and funding
LinkOut - more resources
Full Text Sources
Other Literature Sources
