Randomized Controlled Trial
. 2014 May;14(5):1142-51.
doi: 10.1111/ajt.12712. Epub 2014 Mar 31.

Renal transplantation using belatacept without maintenance steroids or calcineurin inhibitors

Affiliations
Randomized Controlled Trial

Renal transplantation using belatacept without maintenance steroids or calcineurin inhibitors

A D Kirk et al. Am J Transplant. 2014 May.

Abstract

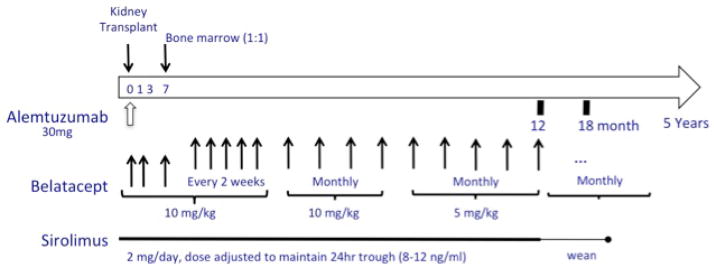
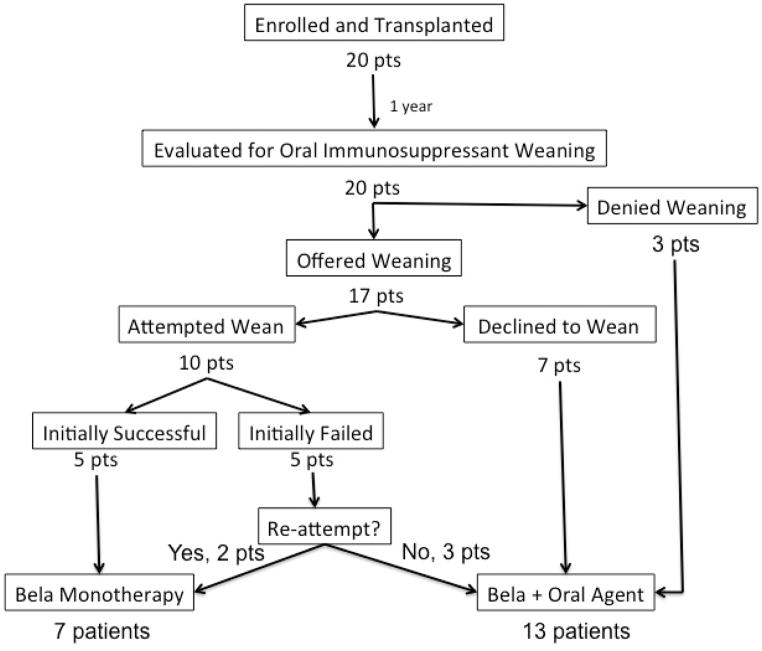
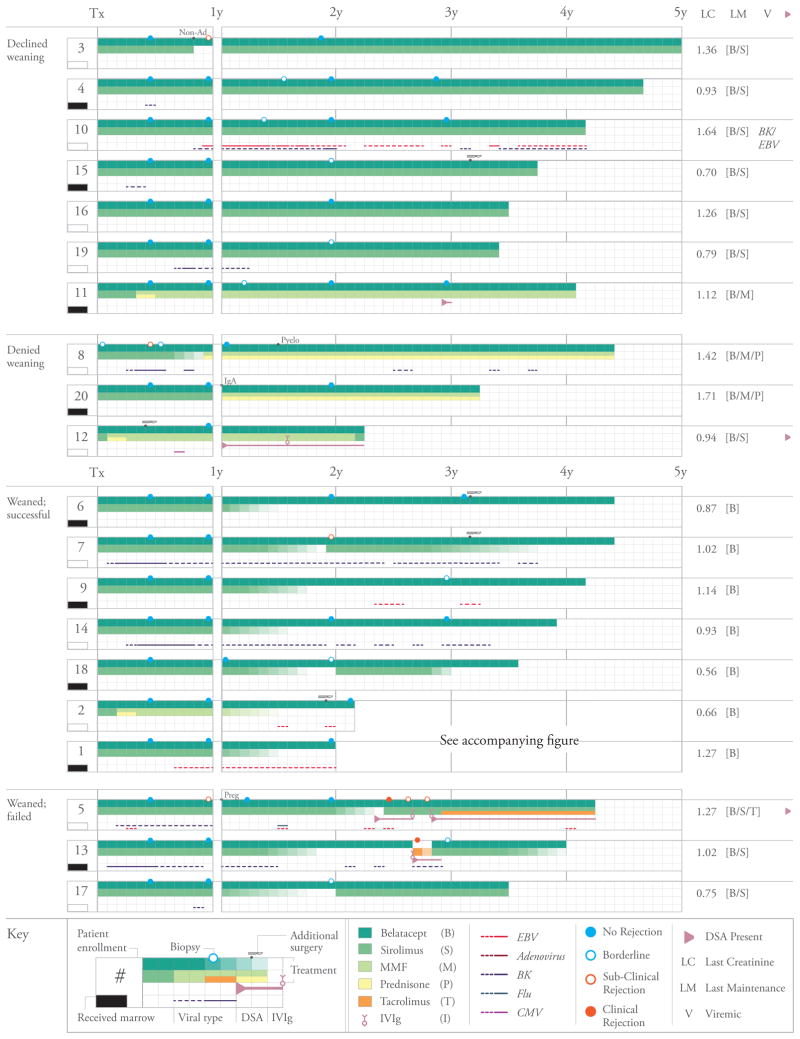
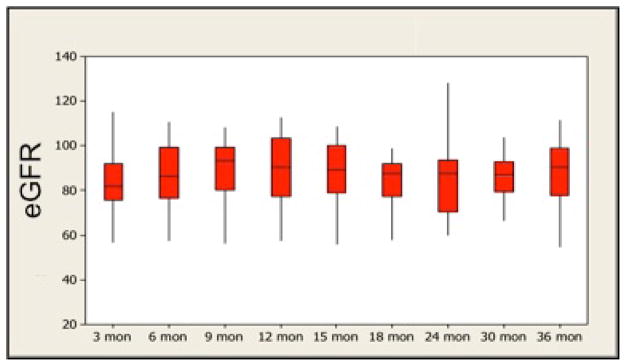
Kidney transplantation remains limited by toxicities of calcineurin inhibitors (CNIs) and steroids. Belatacept is a less toxic CNI alternative, but existing regimens rely on steroids and have higher rejection rates. Experimentally, donor bone marrow and sirolimus promote belatacept's efficacy. To investigate a belatacept-based regimen without CNIs or steroids, we transplanted recipients of live donor kidneys using alemtuzumab induction, monthly belatacept and daily sirolimus. Patients were randomized 1:1 to receive unfractionated donor bone marrow. After 1 year, patients were allowed to wean from sirolimus. Patients were followed clinically and with surveillance biopsies. Twenty patients were transplanted, all successfully. Mean creatinine (estimated GFR) was 1.10 ± 0.07 mg/dL (89 ± 3.56 mL/min) and 1.13 ± 0.07 mg/dL (and 88 ± 3.48 mL/min) at 12 and 36 months, respectively. Excellent results were achieved irrespective of bone marrow infusion. Ten patients elected oral immunosuppressant weaning, seven of whom were maintained rejection-free on monotherapy belatacept. Those failing to wean were successfully maintained on belatacept-based regimens supplemented by oral immunosuppression. Seven patients declined immunosuppressant weaning and three patients were denied weaning for associated medical conditions; all remained rejection-free. Belatacept and sirolimus effectively prevent kidney allograft rejection without CNIs or steroids when used following alemtuzumab induction. Selected, immunologically low-risk patients can be maintained solely on once monthly intravenous belatacept.

Trial registration: ClinicalTrials.gov NCT00565773.

Keywords: Alemtuzumab; belatacept; costimulation; immunosuppressive regimens; minimization/withdrawal; sirolimus.


Conflict of interest statement

Disclosure

The authors of this manuscript have no conflicts of interest to disclose as described by the American Journal of Transplantation.

Figures

Figure 1
Figure 1
(A) Scheme of the immune therapy and monitoring for the trial. (B) Trial conduct with regard to weaning of oral immunosuppressive medication.
Figure 1
Figure 1
(A) Scheme of the immune therapy and monitoring for the trial. (B) Trial conduct with regard to weaning of oral immunosuppressive medication.
Figure 2
Figure 2
The clinical course of all patients group with relation to their participation and success of oral immunosuppressant weaning. Patient numbers refer to their order of enrollment into the trial (not necessarily the order in which they were transplanted). Shown for each patient is the immunosuppressive therapy received by month, receipt of bone marrow, deviation from the base regimen, duration and type of all episodes of viremia, results of all biopsies, any occurrence of DSA, and creatinine, maintenance therapy and presence of DSA or viremia at last follow-up. Dotted lines refer to viremia defined as low positive (present at the limit of the clinical assay) whereas solid lines refer to viremia occurring in the quantifiable range. The scalpel icon indicates surgical procedures performed after transplantation (e.g. native nephrectomy or hernia repair). See pictorial key for details
Figure 3
Figure 3
Estimated glomerular filtration (eGFR; calculated using the Nankivell formula)[35] rate for all patients through 36 months of follow-up.
Figure 4
Figure 4
The clinical course of two patients who were weaned off of all immunosuppressive therapy. Shown for both patients is the immunosuppressive therapy received by month, receipt of bone marrow, deviation from the base regimen, duration and type of all episodes of viremia, results of all biopsies, any occurrence of DSA, and creatinine, maintenance therapy and presence of DSA or viremia at last follow-up beginning from the 1 year time point post transplantation (initiation of initial weaning). Dotted lines refer to viremia defined as low positive (present at the limit of the clinical assay) whereas solid lines refer to viremia occurring in the quantifiable range. The scalpel icon indicates a surgical procedure (in this case total knee replacement) performed after transplantation. See pictorial key for details.
Figure 5
Figure 5
Lymphocyte repopulation and changes in lymphocyte phenotype over the course of the trial. (A) T cell (CD3+ cells) and B cell (CD3, CD20+) absolute numbers prior to and following transplantation showing a return of B cells prior to T cells. T cells are further segregated by CD4 and CD8 (graphs, upper right) by Ki67 expression showing the duration and magnitude of homeostatic proliferation post depletion. Homeostatic activation reaches baseline at month 18 (≈). (B) Cells with potential regulatory function occurring during the period of homeostatic population following transplantation. Shown are surges of Regulatory T cells (CD4+CD25+FoxP3+), gamma-delta T cells (showing a reconstitution with an inverted Vδ1/Vδ2 ratio), Transitional B cells and B regulator cells corresponding to the period of homeostatic activation shown in 5a. (C) CD8+ T cell memory phenotypes showing reconstitution of the CD8+ T cell repertoire with significantly higher percentages of naïve and significantly lower percentages of effector memory and terminal effectors following the end of homeostatic repopulation. * p ≤0.05. (D) Reconstitution of the T cell repertoire with regard to CD28 expression, showing an increase in nonactivated (CD2lo) CD28 expressing cells (p=0.0394), and a decrease in activated CD2hi) CD28 and activated CD28+ cells (p=0.034 and 0.018, respectively). There is no change (NC) seen in nonactivated CD28 cells.
Figure 5
Figure 5
Lymphocyte repopulation and changes in lymphocyte phenotype over the course of the trial. (A) T cell (CD3+ cells) and B cell (CD3, CD20+) absolute numbers prior to and following transplantation showing a return of B cells prior to T cells. T cells are further segregated by CD4 and CD8 (graphs, upper right) by Ki67 expression showing the duration and magnitude of homeostatic proliferation post depletion. Homeostatic activation reaches baseline at month 18 (≈). (B) Cells with potential regulatory function occurring during the period of homeostatic population following transplantation. Shown are surges of Regulatory T cells (CD4+CD25+FoxP3+), gamma-delta T cells (showing a reconstitution with an inverted Vδ1/Vδ2 ratio), Transitional B cells and B regulator cells corresponding to the period of homeostatic activation shown in 5a. (C) CD8+ T cell memory phenotypes showing reconstitution of the CD8+ T cell repertoire with significantly higher percentages of naïve and significantly lower percentages of effector memory and terminal effectors following the end of homeostatic repopulation. * p ≤0.05. (D) Reconstitution of the T cell repertoire with regard to CD28 expression, showing an increase in nonactivated (CD2lo) CD28 expressing cells (p=0.0394), and a decrease in activated CD2hi) CD28 and activated CD28+ cells (p=0.034 and 0.018, respectively). There is no change (NC) seen in nonactivated CD28 cells.

Comment in

References

    1. Organ Procurement and Transplantation Network (OPTN) and Scientific Registry or Transplant Recipients (SRTR) OPTN/SRTR 2010 Annual Data Report. Department of Health and Human Services, Health and Services Administration, Healthcare Systems Bureau, Division of Transplantation. Am J Transplant. 2012;12(Suppl1):S1–154.
    1. Kidney Disease: Improving Global Outcomes (KDIGO) Transplant Work Group. KDIGO clinical practice guideline for the care of kidney transplant recipients. Am J Transplant. 2009;9(Suppl 3):S1–155. - PubMed
    1. Lamb KE, Lodhi S, Meier-Kriesche HU. Long-term renal allograft survival in the United States: a critical reappraisal. Am J Transplant. 2011;11:450–462. - PubMed
    1. Larsen CP, Pearson TC, Adams AB, Tso P, Shirasugi N, Strobert E, Anderson D, Cowan S, Price K, Naemura J, Emswiler J, Greene J, Turk LA, Bajorath J, Townsend R, Hagerty D, Linsley PS, Peach RJ. Rational development of LEA29Y (belatacept), a high-affinity variant of CTLA4-Ig with potent immunosuppressive properties. Am J Transplant. 2005;5:443–453. - PubMed
    1. Vincenti F, Larsen C, Durrbach A, Wekerle T, Nashan B, Blancho G, Lang P, Grinyo J, Halloran PF, Solez K, Hagerty D, Levy E, Zhou W, Natarajan K, Charpentier B Belatacept Study Group. Costimulation blockade with belatacept in renal transplantation. N Engl J Med. 2005;353:770–781. - PubMed

Publication types

MeSH terms

Associated data