Review
. 2014 Apr 9;114(7):3854-918.
doi: 10.1021/cr4005296. Epub 2014 Apr 1.

Superoxide dismutases and superoxide reductases

Affiliations
Review

Superoxide dismutases and superoxide reductases

Yuewei Sheng et al. Chem Rev. .
No abstract available


Figures

Figure 1
Figure 1
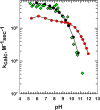
The rate constants of superoxide self-disproportionation (◆) and disproportionation catalyzed by human CuZnSOD as a function of pH (●) are shown for comparison.
Scheme 1
Scheme 1. Reaction of a Glycyl Radical Enzyme Intermediate with O2
Figure 2
Figure 2
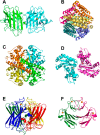
Stereo ribbon diagrams of SODs and SORs: (A) CuZnSOD (PDB code: 1PU0); (B) NiSOD (PDB code: 1T6U); (C) MnSOD (PDB code: 3LSU); (D) FeSOD (PDB code: 3JS4); (E) P. furiosus 1Fe-SOR (PDB code: 1DO6); and (F) D. desulfuricans 2Fe-SOR (PDB code: 1DFX). The diagrams are colored by chains, and the metal ions are shown as spheres. The diagrams were generated using the PyMOL Molecular Graphics System.
Figure 3
Figure 3
The reactivity of SODs as a function of pH. The enzymes are: human CuZnSOD (red ●), E. coli MnSOD (●), and S. seoulensis NiSOD (green ◆).
Figure 4
Figure 4
The reduction potentials of the catalytic metal ion in SODs and SORs fall between the potentials for one-electron oxidation and one-electron reduction of superoxide.
Scheme 2
Scheme 2. Transfer of Two Protons Is Necessary for the Formation of H2O2
Figure 5
Figure 5
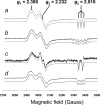
X-band EPR spectra of NiSOD. The experimental spectrum in each panel (upper spectrum) is compared to a simulated spectrum (lower spectrum) (reprinted with permission from ref (88)). (a) Native enzyme with naturally abundant isotopes. The simulation uses the following parameters: gxyz = 2.306, 2.232, and 2.016; Axyz = 16.2, 17.7, and 24.6 G; and lxyz = 28, 17, and 7.8 G. (b) NiSOD enriched with 61Ni, giving unambiguous identification of the rhombic EPR signal to Ni. The simulation is based on the assumption that the signal is a composite of 87% of the 61Ni (I = 3/2) signal and 13% of the normal Ni (I = 0) signal. Hyperfine splitting values used for the nitrogen are as in (a) and for 61Ni are Axyz = 5, 5, and 30 G. (c) NiSOD enriched with 15N. The spectrum shows two prominent lines in the g3 region instead of three as for normal enzyme, indicating that at least one nitrogen ligand is involved in Ni coordination in resting enzyme. Hyperfine splitting values used for 15N are Axyz = 22.7, 24.8, and 34.4 G. A clear splitting is observed in the g = 2.23 region, which was not resolved in spectra with 14N donors at 100 K. (d) NiSOD enriched with 33S gives direct evidence for sulfur ligands of Ni. The simulation assumes equal hyperfine interaction with two 33S nuclei. Hyperfine splitting values used for 33S are Axyz = 3.6, 3.6, and 3.6 G. Microwave frequency, 9.482 GHz; temperature, 100 K.
Figure 6
Figure 6
A comparison of the pH-dependence of kcat for native S. seoulensis NiSOD (green), recombinant S. coelicolor NiSOD (blue), and E. coli MnSOD (magenta).
Figure 7
Figure 7
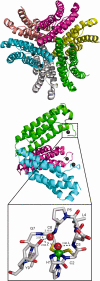
Structure of S. coelicolor NiSOD (PDB code: 1T6U) viewed down the 3-fold axis of the hexamer (top); a single trimeric unit (middle) viewed along a 2-fold axis in the hexamer, and the Ni-hook motif (bottom), in the oxidized state and showing the active site water molecules and hydrogen-bonding network. This figure was generated using the PyMOL Molecular Graphics System.
Figure 8
Figure 8
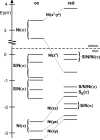
DFT frontier molecular orbital energy diagrams for oxidized (His-on, spin–down orbitals from an unrestricted calculation) and reduced (His-off) NiSOD (adapted from ref (87b)).
Figure 9
Figure 9
Superposition of the Ni-hook domains of WT (blue), Tyr9Phe (purple), and Asp3Ala (orange) NiSODs showing the position of residue 9 (reproduced from ref (59)). The green sphere represents the Ni position in all three structures, and the purple sphere indicates the Cl or Br position in Tyr9Phe-NiSOD. The blue and orange spheres represent water molecules present in WT and Asp3Ala NiSOD, respectively.
Figure 10
Figure 10
S K-edge spectra for S. coelicolor WT NiSOD during photoreduction in the X-ray beam (red-gray spectra) and reduced with H2O2 (blue). The NiSOD samples are compared with spectrum obtained from cysteine (black) (adapted from ref (99) with permission). The feature marked A (2469.7 eV) is lost upon X-ray reduction, while B (2470.9) is retained.
Figure 11
Figure 11
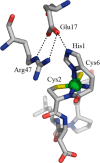
The Ni-hook motif shown with intersubunit His1···Glu17 hydrogen bond and supporting intrasubunit Glu17···Arg47 interaction.
Figure 12
Figure 12
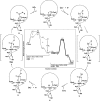
Proposed catalytic cycle for NiSODs from DFT calculations and free energy diagrams (center) for the oxidative and reductive half-reactions (adapted from ref (97)).
Figure 13
Figure 13
Overlay of the backbones of E. coli FeSOD (orange) and MnSOD (magenta) based on the coordinates of Lah et al (PDB code: 1ISB). and Borgstahl et al (PDB code: 1D5N). This figure and Figures 17, 21, and 22 were generated using Chimera and swissPDBviewer.
Figure 14
Figure 14
Ribbon structure of E. coli FeSOD (top) and close-up view of the active site (bottom) based on the coordinates of Lah et al. (PDB code: 1ISB). Hydrogen bonds are dashed lines, and coordination bonds are solid lines. Within each monomer, the N-terminal domain is in green and the C-terminal domain is in teal. This figure was generated using the PyMOL Molecular Graphics System.
Scheme 3
Scheme 3. Mechanism of FeSOD
Steps 1 and 2 contribute to eq 16, and steps 3, 4, and 5 contribute to eq 17. The individual second-order rate constants for eqs 16 and 17 are 5.2 × 10⁸ and 5.5 × 10⁸ M–1 s–1, respectively,, for FeSOD from Photobacterium leiognathi at pH 8, consistent with steady-state turnover with kcat/KM = 5.2 × 10⁸ M–1 s–1..
Figure 15
Figure 15
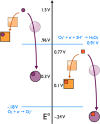
Cartoon of the differential redox tuning by the (Fe)SOD and (Mn)SOD proteins and its effects on the Fe and Mn high-spin 3+/2+ couples (adapted from refs (179,192) with E°’s drawn from refs (3,74a,75a)). Orange squares depict the (Fe)SOD protein and violet circles represent the (Mn)SOD protein; the corresponding metal ions are shown as red squares or purple circles. Apo-proteins lack the symbol for the metal ion. Reduction potentials vs NHE are marked on the vertical axis, and the protein–metal ion complexes or hexaaquo complexes are positioned vertically in accordance with this scale.
Figure 16
Figure 16
Thermodynamic cycle of metal ion reduction coupled to proton transfer for the example of Fe3+SOD, where L is the SOD protein. The energy associated with reduction of Fe3+ coordinated to the protonated form of an acidic ligand is considered in the form of the reduction potential E°AH; the corresponding potential for Fe3+coordinated to the deprotonated form of the ligand is E°A; the energy for protonation of the ligand is considered in the form of pKa’s: pKaox for the case where the Fe is oxidized and pKared for the case where the metal ion is reduced.
Figure 17
Figure 17
Retention of overall structure by the active sites of four FeSODs and MnSOD variants that have E°’s spanning >0.9 V. Magenta, E. coli Fe(Mn)SOD (PDB code: 1VEW); yellow, E. coli WT Fe3+SOD (PDB code: 1ISB); orange, E. coli Q69HFeSOD (PDB code: 1ZA5); red, E. coli Q69E-FeSOD (PDB code: 2NYB). Dashed lines indicate hydrogen-bond donation from Gln146 to the OH ligand of MnSOD in blue and hydrogen-bond acceptance by the Glu69 of Q69E-FeSOD from the H2O ligand in red.
Figure 18
Figure 18
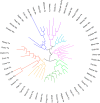
Unrooted dendogram of 53 members of the FeSOD and MnSOD family wherein branches are colored as follows (clockwise from top left): blue for mitochondrial MnSODs, magenta for archaeal SODs, teal for actinobacterial SODs, pink for bacterial MnSODs, light green for cyanobacterial FeSODs, dark green for FeSODs of plants and green algae, red for FeSODs of protists, and orange for FeSODs of bacteria. Sequences were chosen to represent diverse groups of organisms and different metal specificities. BLAST searches of the nonredundant database of the National Center for Biotechnology and Information (NCBI) were used to identify additional SOD sequences from weakly represented groups, and, in those cases in which sequences were very similar, only one exemplar was retained, the one for which the best information on metal ion use was available. Where possible, for bacterial and archaeal SODs especially, the identity of an SOD as Fe-dependent versus Mn-dependent was sought in primary literature, and the means by which its metal ion identity was determined is listed as “Anal” for direct analysis via atomic absorption or another spectroscopic method, or “H2O2” when it was inferred on the basis of the SOD’s sensitivity or resistance to inactivation by H2O2 and a reference is provided. Some Fe/MnSODs are included, but given that the motivation of this exercise was to identify residues that correlate differentially with Fe or Mn use, others are described via Table 4 instead. The tree was displayed and colored using the interactive tree of life server hosted by the European Molecular Biology Laboratory. The multiple sequence alignment upon which it is based was generated using MUSCLE (in the “full” most stringent mode) for up to 16 interactions, as accessed via Phylogeny.fr hosted by the Centre National de la Recherche Scientifique. The alignment was curated using Gblocks at the most stringent setting (not allowing many contiguous nonconserved positions), and the results were inspected visually via the Phylogeny.fr interface. The phylogenetic tree was constructed by PhyML using the approximate likelihood-ratio test and using the substitution model of Jones, Taylor, and Thornton with default parameters, and gaps were removed from the alignment. The tree topology was confirmed with COBALT via the National Center for Biotechnology Information server. The sequences are identified in the figure using the following abbreviations corresponding to the following accession numbers: Afumig-Mn, Aspergillus fumigatus MnSOD (Eukaryota-mito) GI:18158811; Ahydro-Fe, Aeromonas hydrophila FeSOD (Gammaproteobacteria-Fe) GI:75530508; Anabae-Mn, Anabaena MnSOD (Cyanobacteria) GI:23200075 H2O2; Apernix-Mn/Fe, Aeropyrum pernix Mn/FeSOD (Crenarchaeota) GI:321159640; Athali-Fe, Arabidopsis thaliana FeSOD (Viridiplantae) GI:332659609; Athal-Mn, Arabidopsis thaliana MnSOD (Viridiplantae-mito) GI:15228407; Avine-Fe, Azotobacter vinelandii FeSOD (Gammaproteobacteria-Fe) GI:226720755 Anal.; Bthuri-Mn, Bacillus thuringiensis MnSOD (Firmicutes) GI:228830333; Cauran-Mn, Chloroflexus aurantiacus MnSOD (Chloroflexii) GI:31074373 Anal.; Cburne-Fe, Coxiella burnetii FeSOD (Gammaproteobacteria-Fe) GI:145002 H2O2; Cgluta-Mn, Corynebacterium glutamicum MnSOD (Actinobacteria) GI:81783000; Cjejun-Fe, Campylobacter jejuni FeSOD (Epsilonproteobacteria) GI:218561849 H2O2; Creinh-Fe, Chlamydomonas reinhard FeSOD (Viridiplantae) GI:158280091; Dmelan-Mn, Drosophila melanogaster MnSOD (Eukaryota-mito) GI:7302882; Dradio-Mn, Deinococcus radiodurans MnSOD (Bacteria-Deinococ) GI:32363428; Ecoli-Fe, E. coli FeSOD (Gammaproteobacteria-Fe) GI:84028734 Anal; Ecoli-Mn, E. coli MnSOD (Gammaproteobacteria-Mn) GI:134659 Anal;, Ehist-Fe, Entamoeba histolytica FeSOD (protozoan-Eukaryota) GI:464774 H2O2; Ggallu-Mn, Gallus gallus MnSOD (Eukaryota-mito) GI:15419940; Hpylor-Fe, Helicobacter pylori FeSOD (Epsilonproteobacteria) GI:190016324; Hsap-Mn, Homo sapiens MnSOD (Eukaryota-mito) GI:24987871; Livano-Mn, Listeria ivanovii MnSOD (Firmicutes) GI:134666; Mbark-Fe, Methanosarcina barkeri FeSOD (Euryarchaeota) GI:499627762 Anal.; Methylo-Mn, Methylomonas MnSOD (Gammaproteobacteria-Mn) GI:95281 Anal; Mpalea-Fe, Marchantia paleacea FeSOD (Viridiplantae) GI:75243372; Msativ-Fe, Medicago sativa FeSOD (Viridiplantae) GI:75248782; Msmeg-Mn, Mycobacterium smegmatis MnSOD (Actinobacteria) GI:21264517 Anal; Mthermo-Fe, Methanobacterium thermoauto FeSOD (Euryarchaeota) GI:23200500; Mtuber-Fe, Mycobacterium tuberculosis FeSOD (Actinobacteria) GI:809164 H2O2; Nmenin-Fe, Neisseria meningitidis FeSOD (Betaproteobacteria) GI:7226122; Naster-Mn, Nocardia asteroides MnSOD (Actinobacteria) GI:1711453; Nostoc-Fe, Nostoc PCC7120 FeSOD (Cyanobacteria) GI:17132032; Paeroph-Mn/Fe, Pyrobaculum aerophilum Mn/FeSOD (Crenarchaeota) GI:14917043; Pborya-Fe,: Plectonema boryanum FeSOD (Cyanobacteria) GI:1711435 Anal; Pfalc-Fe, Plasmodium falciparum FeSOD (protozoan-Eukaryota) GI:74946757; Pfreud-FeMn, Propionibacterium freudenreichii (shermanii) Fe/MnSOD (Actinobacteria) GI:5542134 Anal.; Phalo-Fe, Pseudoalteromonas haloplanktis FeSOD (Gammaproteobacteria-Fe) GI:306440524; Pleiog-Fe, Photobacterium leiognathi FeSOD (Gammaproteobacteria-Fe) GI:134643 Anal; Poliv-Mn, Paralichthys olivaceus MnSOD (Eukaryota-mito) GI:134676; Poval-Fe, Pseudomonas ovalis FeSOD (Gammaproteobacteria-Fe) GI:12084342 Anal; Ppinas-Fe, Pinus pinaster FeSOD (Viridiplantae) GI:75223482; Scere-Mn, Saccharomyces cerevisiae MnSOD (Eukaryota-mito) GI:217035334; Ssolfa-Fe, Sulfolobus solfataricus FeSOD (Crenarchaeota) GI:14286093 Anal.;, Synech-Fe, Synechocystis 6803 FeSOD (Cyanobacteria) GI:1653111; Taest-Mn, Triticum aestivum MnSOD (Viridiplantae-mito) GI:62131095; Taq-Mn, Thermus aquaticus MnSOD (Bacteria-Deinococ) GI:1711455; Tbruce-Fe, Trypanosoma brucei B2 FeSOD (protozoan-Eukaryota) GI:70834946 H2O2; Telong-Fe, Thermosynechococcus elongatus FeSOD (Cyanobacteria) GI:34810955; Tgondi-Fe, Toxoplasma gondii FeSOD (protozoan-Eukaryota) GI:122066229; Vcart-Fe, Volvox carteri FeSOD (Viridiplantae) GI:121077704; Vchol-Mn, Vibrio cholerae MnSOD (Gammaproteobacteria-Mn) GI:14039308 upregulation in absence of Fe; Vungui-Fe, Vigna unguiculata FeSOD (Viridiplantae) GI:56554197 H2O2; Xcamp-Mn, Xanthomonas campestris MnSOD (Gammaproteobacteria-Mn) GI:76364224.
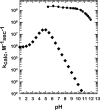
Figure 19
Figure 19
Alignment of consensus amino acid sequences from the different groups of SOD in Figure 18. Bold green letters indicate amino acids conserved in all 53 individual sequences, letters in blue indicate residues that are similar in all 53 sequences, letters in red indicate residues that distinguish FeSODs from others, letters in purple indicate residues that distinguish MnSODs from others. For each group of SODs the individual sequences were aligned, the conserved amino acid identities are presented as capital letters and positions where similarity is preserved within the group are shown as lower case letters. 'X' is used to mark the positions at which diverse amino acids are found. These consensus sequences for the different groups are then presented together in their global alignment. The different groups are PltCya: FeSODs from plants and cyanobacteria (11 sequences, numbering of A. thaliana), ProtistFe: FeSODs from protists (5 sequences, numbering of Entamoeba histolica), Bact-Fe: FeSODs from bacteria (9 sequences, numbering of E. coli), Bact-Mn: MnSODs from non-actinobacterial bacteria (10 sequences, numbering of E. coli), ArchActino: Fe-, Mn- and Fe/MnSODs from actinobacteria and archaea (10 sequences, numbering of P. aerophilum) and Mito-Mn: MnSODs from mitochondria (8 sequences, numbering of H. sapiens). Consensus sequences were generated using Clustal-Omega multiple sequence alignments of the sequences listed in the caption of Figure 19 using up to 5 iterations, up to 3 guide-tree iterations and up to three HMM iterations without mBed clustering and allowing dealignment, via the EMBL-EBI server. For each group of sequences residues that were different or only weakly similar within the group were replaced by 'X'. Strongly similar residues were replaced by a lower-case letter indicating the category of residue present at the site with 'f' representing an aromatic side chain, 'l' representing a hydrophobe, 'a' representing A,S or T, 'n' representing a polar/charged side chain (D,E,Q,N,K,R), 'h' representing H or Y, and 'k' representing K or R. Residues that were identical in all sequences in the group were retained as capital letters. These consensus sequences were then aligned using Clustal-Omega to produce the result shown. All alignments were confirmed with COBALT via the NCBI server. Numbering of E. coli SODs omits the N-terminal M, to produce agreement with amino acid numbering used in crystal structures. Stretches of amino acids participating in α-helices are indicated by 'a's and stretches participating in β-sheet strands by 'b's above each row.
Figure 20
Figure 20
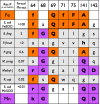
Comparison of the residues at seven proposed specificity signature positions among 6 Fe/MnSODs with different metal ion dependencies for activity. Fe/Mn SODs from B. fragilis, P. freudenrichii, P. gingivalis, M. smegmatis, Mehylomonas J, and R. capsulatus (gray rows) are compared to the FeSOD and MnSOD from E. coli (white rows). Residues conserved among FeSODs but not among MnSODs are considered signatures of Fe specificity and are colored in orange (proposed Fe specificity signature residues 52 and 165 are omitted from this figure because they are more distant from the active site and could act via indirect or different means). Residues conserved among MnSODs but not among FeSODs are considered signatures of Mn specificity and are colored in purple. For each SOD, the ratio of its Fe-supported activity divided by its Mn-supported activity under the same conditions is reported (see also Table 5). Use of upper case and lower case letters follows the convention used for Figure 19.
Figure 21
Figure 21
(A) Ribbon structure of E.coli FeSOD with residues conserved among all our Fe- and/or MnSODs in green, residues similar in all in blue, residues proposed to be signatures of Fe-specificity in orange-red and residues proposed to be signatures of Mn-specificity in purple from the structure of E. coli MnSOD overlaid on the structure of FeSOD but not shown; (B) right-hand monomer, rotated to bring its right-side to face the viewer and indicating with dashed circles clusters of residues similar in all Fe- and/or MnSODs that form hydrophobic cores of the N and C terminal domains. Figure is based on the coordinate sets 1ISB and 1D5N. Residues specific to FeSODs are based on 25 sequences, residues specific to the non-actinobacterial, non-archaeal MnSODs are based on 18 sequences. Conserved residues are four ligands of the metal ion (His26, His73, His160, Asp156), two participants in the active site H-bond network (His30, Tyr34), two that may aid in defining the conformation of the ligand side chains (His31, Ala161), and two that bridge the interface between monomers (Glu159 and Tyr163). Gly119 is also conserved, occurring before the beginning of the β-sheet where it appears to facilitate a sharp bend in the peptide backbone.
Figure 22
Figure 22
Residues constituting conserved differences between FeSODs and MnSODs, near the active site based on the coordinate sets 1ISB and 1D5N from E. coli proteins (A) superposition of FeSOD (grey ribbon) and MnSOD (orchid ribbon). Green residues are conserved in all SODs, orange-red are specific to FeSODs (in our set of sequences), purple are specific to MnSODs (in our sequences and exclusing actinobacterial and archaeal SODs). (B) FeSOD only with space-filling depiction of Fe-specific Gln69 and residues that buttress it (Ala141 and Phe64) or contribute bulk to the back-side of the helix (Phe71 and Phe75). (C) MnSOD only with space-filling depiction of Mn-specific residues (Gln141, and Arg64 and Asp142 in FeSOD numbering; Gln146, Arg72 and Asp147 in MnSOD numbering) that are conserved among Mn-specific SODs and may help to hold together two domains with a salt bridge.
Figure 23
Figure 23
The structure of the dimeric (A) and tetrameric (B) MnSODs, showing the ribbon diagrams of E. coli (PDB code: 1VEW) and S. cerevisiae (PDB code: 3LSU) MnSOD. Comparison of the monomer structure between E. coli (orange) and S. cerevisiae (green) MnSOD is shown in panel C. The diagrams were generated using the PyMOL Molecular Graphics System.
Figure 24
Figure 24
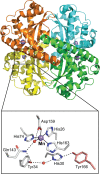
The tetrameric assembly (top) and active site structure (bottom) of human MnSOD (PDB code: 1LUV). The metal-binding ligands are His26, His74, His163, and Asp159. The hydrogen-bonding network is defined from the bound water to Gln143, Tyr34, the water between Tyr34 and His30, His30, and finally Tyr166 from the adjacent subunit (pink). The diagrams were generated using the PyMOL Molecular Graphics System.
Figure 25
Figure 25
The active site structure of the human WT MnSOD (PDB code: 1LUV) and three mutants of the hydrogen-bonding network, Y34F (PDB code: 1AP5), Q143A (PDB code: 1EM1), and H30V (PDB code: 1N0N). Metal ions and solvent molecules are shown as spheres, and coordination and hydrogen bonds are shown as solid and dashed lines, respectively. The diagrams were generated using the PyMOL Molecular Graphics System.
Figure 26
Figure 26
Disappearance of different amounts of O2•– in the presence of either 1 μM NiSOD or 1 μM MnSOD.
Scheme 4
Scheme 4. Proposed Mechanisms for MnSOD
Figure 27
Figure 27
Absorption bands formed upon exposing Mn2+SOD to a burst of O2•–. (○) Initial Mn3+SOD species formed immediately after the pulse; (●) final Mn3+SOD species formed after the pulse; and (◇) second transient formed after the pulse. O2•– is substoichiometric to MnSOD ([O2•–]:[MnSOD] < 0.12).
Figure 28
Figure 28
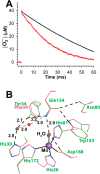
Catalysis and active-site structure of Y34F S. cerevisiae MnSOD (ScMnSOD). (A) Decay of 41 μM O2•– catalyzed by 1 μM human WT MnSOD (black) and Y34F ScMnSOD (red) in pH 7 phosphate buffer. (B) Superimposition of the active site of Y34F ScMnSOD (chain A, red) onto that of WT ScMnSOD (chain A, green) (adapted from ref (251b)). Coordination bonds are indicated as solid lines, and hydrogen bonds are shown as dashed lines in WT (black) and Y34F (gray) ScMnSOD, respectively.
Scheme 5
Scheme 5. Proposed Mechanisms for Y34F ScMnSOD
Figure 29
Figure 29
Disappearance of a burst of O2•– (41μM) in the presence of 1 μM of MnSOD from different organisms under the same conditions.
Figure 30
Figure 30
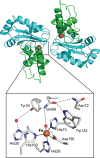
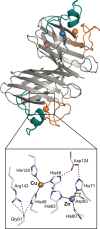
Stereo ribbon diagram of dimeric human SOD1 (top) (reproduced from ref (53)) with the active site highlighted (PDB code: 1PU0) (bottom). Copper and zinc ions are shown as blue and orange spheres, respectively. The zinc loop is shown in orange and the electrostatic loop in teal. The intrasubunit disulfide bond is shown in red. The reduced metal-binding (Cu+) site is shown. The diagrams were generated using the PyMOL Molecular Graphics System.
Figure 31
Figure 31
Schematic mechanism of CCS-dependent hSOD1 maturation in vitro (reproduced from ref (297)). (1) Nascent hSOD1 (E,E-hSODSH) acquires zinc from an unknown source, producing E,Zn-hSOD1SH. (2) The hSOD1SH monomer forms a heterodimer with a monomer Cu(I)-hCCS. The current study suggests that copper transfer (3) occurs before formation of the intermolecular (4), and then hSOD1 intramolecular (5), disulfide bond, resulting in the mature monomer (6) that dimerizes to the active state.
Figure 32
Figure 32
Secondary structure representation of SOD1 showing the locations of FALS-linked mutations (left) and a monomer of SOD1 (right) colored to match the drawing on the left (reproduced from ref (53)). Copper ligands are shown in green and zinc ligands are shown in red. Copper and zinc ions are shown as green and gray spheres, respectively, and the intrasubunit disulfide bond is shown in red. Point mutation, deletions, and insertions are indicated with a line, whereas mutations that cause C-terminal truncations are shown as scissor cuts at the point of the stop codon.
Figure 33
Figure 33
Aggregated forms of SOD1 found in vivo (A and B) and in vitro (C and D). (A) An SOD1-containing inclusion from the spinal cord of a FALS patient expressing a C-terminal truncated mutant SOD1, L126stop (reprinted with permission from ref (420)). (B) SOD1-containing inclusions (arrowheads) from the spinal cord of transgenic mice expressing G85R hSOD1 (reprinted with permission from ref (420)). The tissue was stained with an antibody recognizing both mouse and human SOD1. (C) Electron micrographs of SOD1 fibrils generated in the presence of 1 M GdHCl (left) and 5 mM DTT (right) (scale: 1 cm = 200 nm) (adapted from ref (328b)). (D) AFM images of WT (left) and L38V (right) fibrils (scale: 1 cm = 100 nm) (adapted from ref (329)). Insets show the magnified helical twist of the fibrils.
Figure 34
Figure 34
High-order filamentous assemblies formed by SOD1 mutant proteins (reprinted with permission from ref (334); this figure was modified from Figures 2–4 in the original paper). (A) Orthogonal views of the linear, amyloid-like filaments formed by S134N and apo H46R, represented by three dimers shown from top to bottom in green, gold, and blue, respectively. A schematic diagram of the tubular filament is shown in (i). Image (iv) is related to (ii) and (iii) by a rotation of 90°. (B) Orthogonal views of the zigzag filaments formed by apo H46R, represented by three SOD1 dimers in the same orientation as in (A). Image (iii) is related to (i) and (ii) by a rotation of 90°. (C) Orthogonal views of the water-filled helical filaments formed by Zn-H46R. One-half of the helical Zn-H46R filament, shown in (i) and (ii), is represented by the two dimers shown from top to bottom in green and gold. Image (ii) is related to the left half of (iii) by a rotation of 90°.
Figure 35
Figure 35
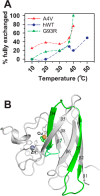
β3 and β4 strands (belonging to peptide 21–53) of apo mutant SOD1s are substantially more unfolded at physiological temperatures than those of apo hWT. (A) Profiles of the fractions of fully exchanged peptide 21–53 are shown as a function of temperature for the hWT, A4V, and G93R SOD1 proteins (reprinted with permission from ref (340)). In this plot, the percentages of fully exchanged peptides are determined by the fractional area under the deconvoluted m/z curves in the mass spectra. (B) Structure of a monomer of hWT SOD1 (PDB code: 1PU0) with peptide 21–53 highlighted in green. This figure was generated using the PyMOL Molecular Graphics System.
Figure 36
Figure 36
Comparison of enzymatic activities of SODs and SORs.
Figure 37
Figure 37
Different domain structures found for proteins containing a SOR catalytic domain (as in SORGOdb). These proteins are variations of the typical 1Fe- and 2Fe-SORs, and should not be viewed as individual catalytic classes. The domains and residues are colored as: blue, catalytic domain; pink, desulforedoxin-like domain; green, Dx like-domain, lacking the Fe center; brown, FeS domain in methanoferrodoxins; light gray, variable domain (HTH, helix–turn–helix domain; TAT, putative twin arginine signal peptide); red, metal ligands; black, highly conserved residues.
Figure 38
Figure 38
Crystallographic structures of 1Fe- and 2Fe-SORs. (A) Structure of P. furiosus 1Fe-SOR tetramer (PDB code: 1DO6), showing the SOR active sites in the oxidized (A.1) and reduced (A.2) forms. (B) Structure of the D. desulfuricans 2Fe-SOR dimer with details of center I (DX-like center) and SOR active site (presumably in the reduced form) shown in B.1 and B.2, respectively. The figures were generated using the PyMOL Molecular Graphics System.
Figure 39
Figure 39
Structural conservation in SORs. (A) Superimposition of 1Fe-SOR (blue) and 2Fe-SOR (red) monomers (PDB codes: 1DO6 and 1DFX); (B) structural conservation of amino acid residues in the monomer of 1Fe-SOR, mapped over P. furiosus structure and made using ConSurf;, and (C) ribbon diagram of the same monomer in B (PDB code: 1DO6). Panels A and C were generated using the PyMOL Molecular Graphics System.
Figure 40
Figure 40
Structure of the (hydro)peroxo intermediate in 2Fe-SOR from D. baarsii (subunit C in PDB 2JI3). This figure was generated using the PyMOL Molecular Graphics System.
Figure 41
Figure 41
pH equilibria in SORs. Left panels: visible spectra of wild-type (A) and E12V (B) A. fulgidus SORs.
Figure 42
Figure 42
Reconstituted spectra of reaction intermediates (T1 and T2) upon pulsing A. fulgidus 1Fe-SOR with O2•–.
Figure 43
Figure 43
Catalytic mechanism for SOR O2•– reduction, contemplating the two possible structures for T1 and the two mechanisms involving one or two macroscopically observed intermediates.

References

    1. Sessions A. L.; Doughty D. M.; Welander P. V.; Summons R. E.; Newman D. K. Curr. Biol. 2009, 19, R567. - PubMed
    1. Raymond J.; Segrè D. Science 2006, 311, 1764. - PubMed
    1. Koppenol W. H.; Stanbury D. M.; Bounds P. L. Free Radical Biol. Med. 2010, 49, 317. - PubMed
    1. Narayana P. A.; Suryanarayana D.; Kevan L. J. Am. Chem. Soc. 1982, 104, 3552.
    2. Martins-Costa M. T. C.; Anglada J. M.; Francisco J. S.; Ruiz-Lopez M. F. Angew. Chem., Int. Ed. 2012, 51, 5413. - PubMed
    1. Bielski B. H.; Cabelli D. E.; Arudi R. L.; Ross A. B. J. Phys. Chem. Ref. Data 1985, 14, 1041.

Publication types

LinkOut - more resources