. 2014 Aug 1;21(4):570-87.
doi: 10.1089/ars.2013.5696. Epub 2014 May 13.

S-nitrosoglutathione reductase deficiency-induced S-nitrosylation results in neuromuscular dysfunction

Affiliations

S-nitrosoglutathione reductase deficiency-induced S-nitrosylation results in neuromuscular dysfunction

Costanza Montagna et al. Antioxid Redox Signal. .

Abstract

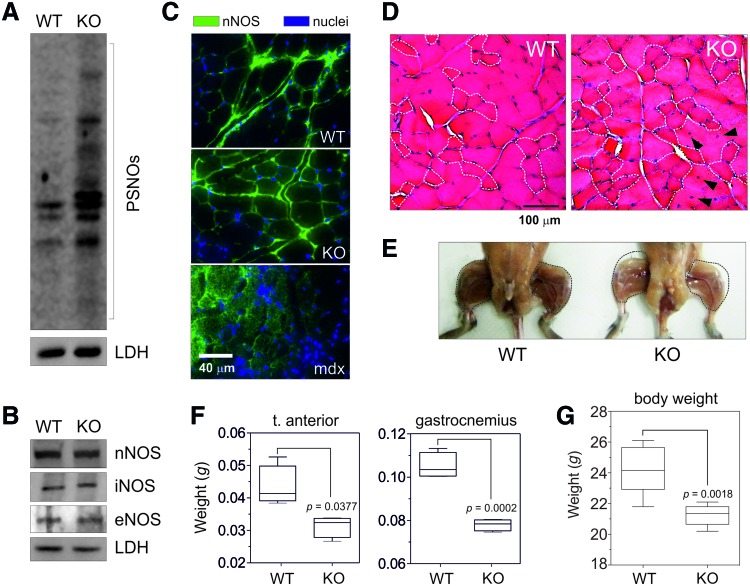
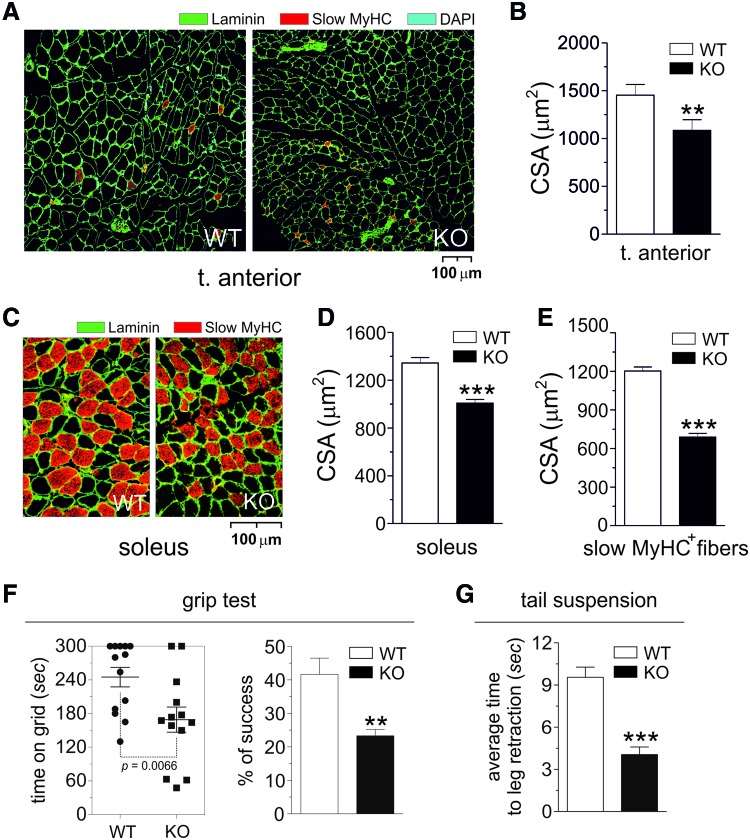
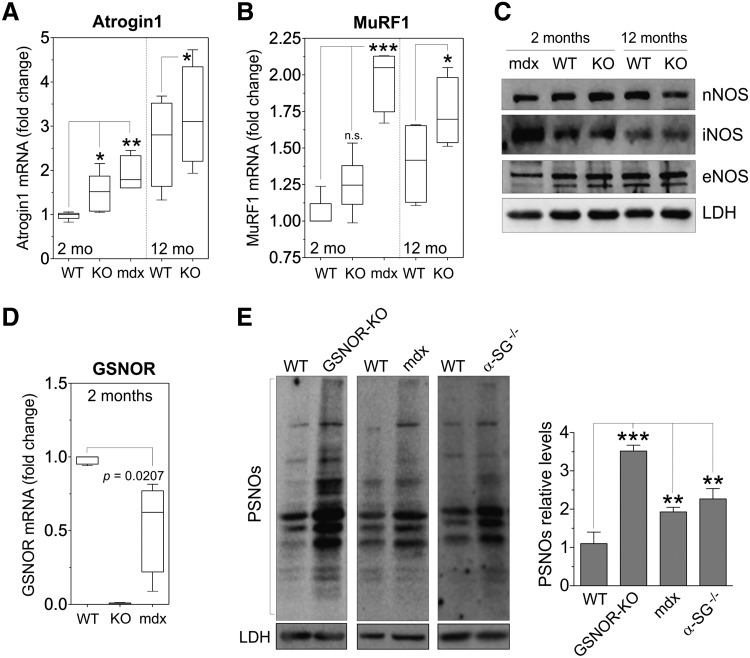
Aims: Nitric oxide (NO) production is implicated in muscle contraction, growth and atrophy, and in the onset of neuropathy. However, many aspects of the mechanism of action of NO are not yet clarified, mainly regarding its role in muscle wasting. Notably, whether NO production-associated neuromuscular atrophy depends on tyrosine nitration or S-nitrosothiols (SNOs) formation is still a matter of debate. Here, we aim at assessing this issue by characterizing the neuromuscular phenotype of S-nitrosoglutathione reductase-null (GSNOR-KO) mice that maintain the capability to produce NO, but are unable to reduce SNOs.

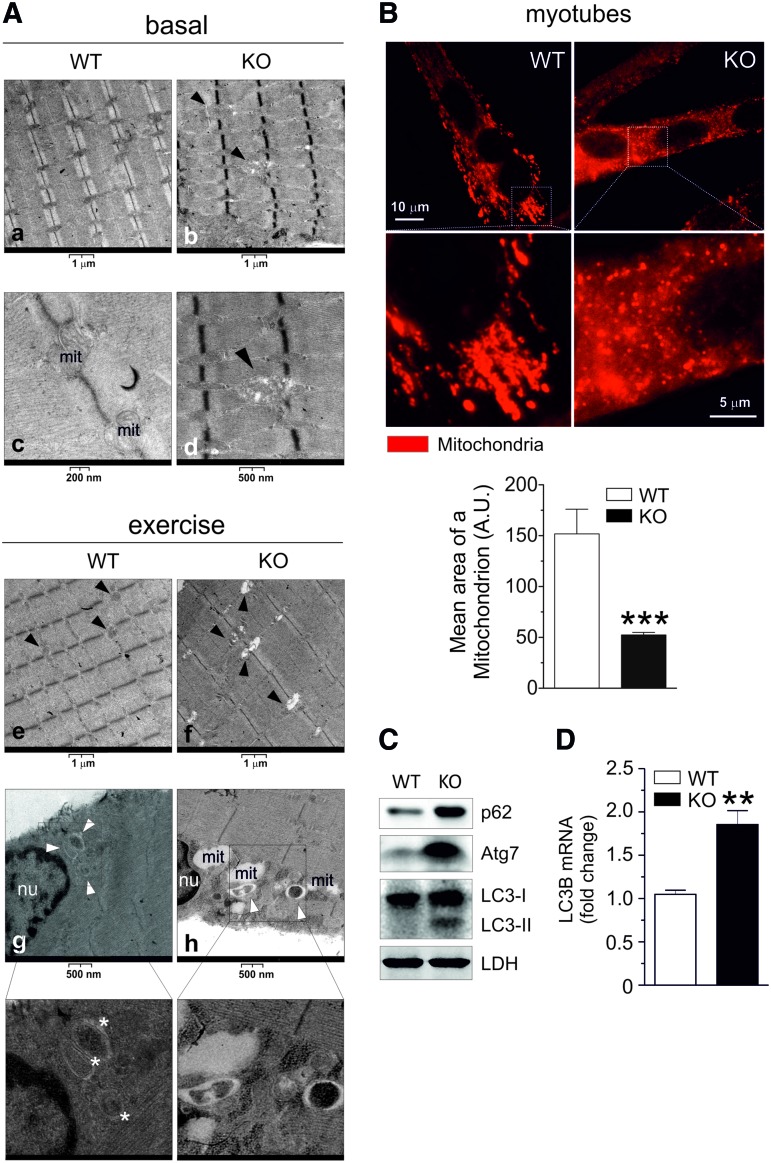
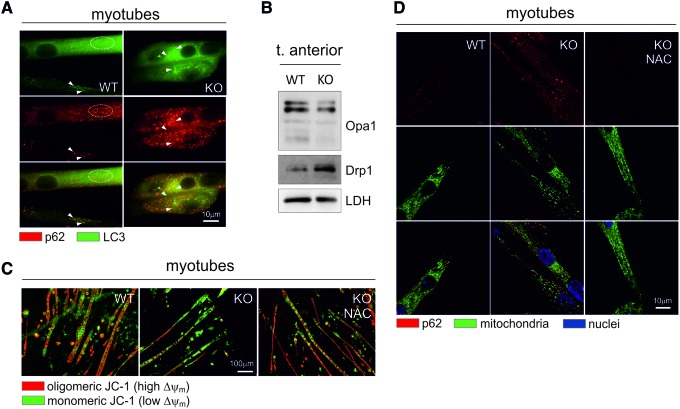
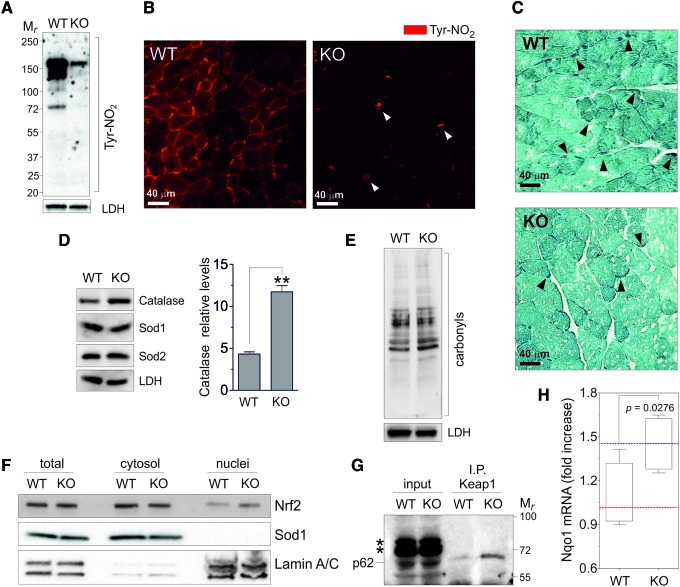
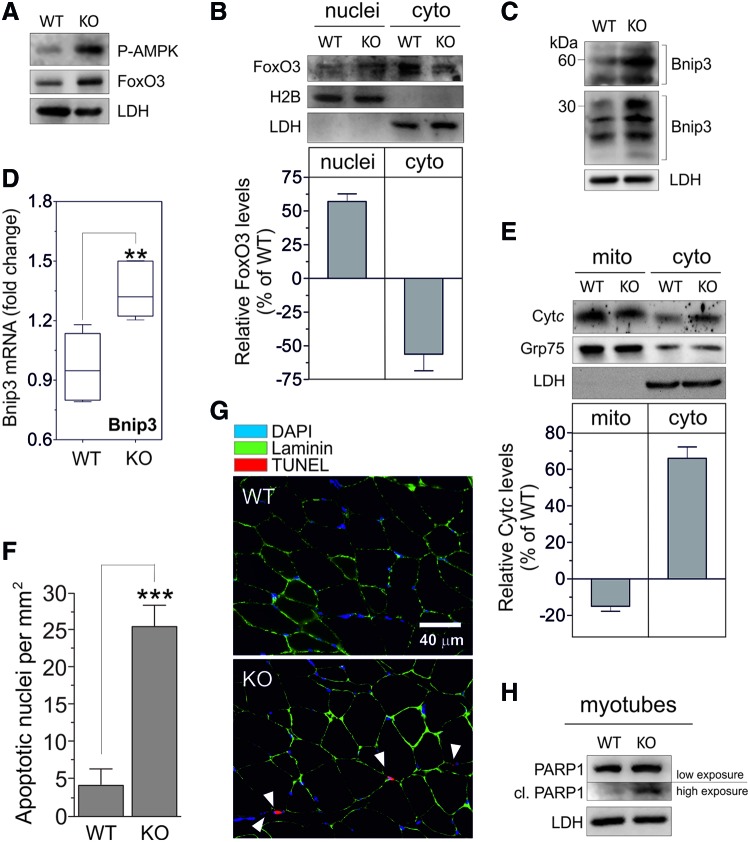
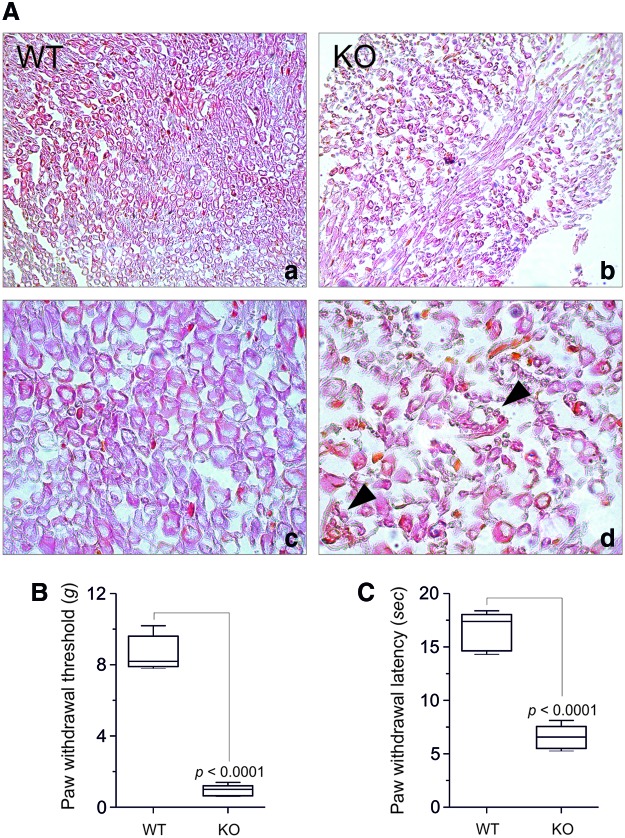
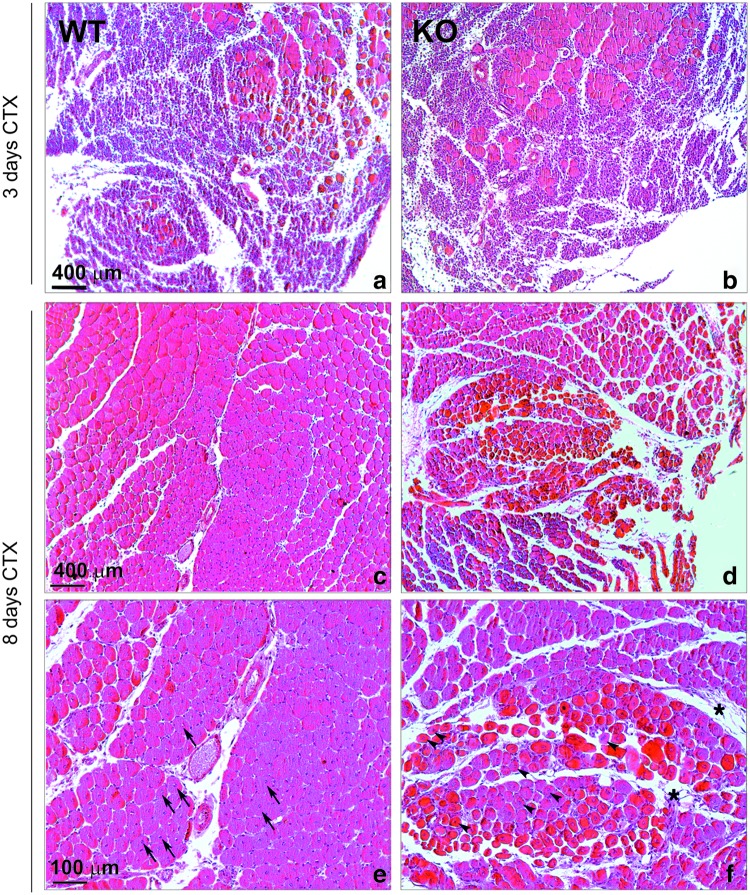
Results: We demonstrate that, without any sign of protein nitration, young GSNOR-KO mice show neuromuscular atrophy due to loss of muscle mass, reduced fiber size, and neuropathic behavior. In particular, GSNOR-KO mice show a significant decrease in nerve axon number, with the myelin sheath appearing disorganized and reduced, leading to a dramatic development of a neuropathic phenotype. Mitochondria appear fragmented and depolarized in GSNOR-KO myofibers and myotubes, conditions that are reverted by N-acetylcysteine treatment. Nevertheless, although atrogene transcription is induced, and bulk autophagy activated, no removal of damaged mitochondria is observed. These events, alongside basal increase of apoptotic markers, contribute to persistence of a neuropathic and myopathic state.

Innovation: Our study provides the first evidence that GSNOR deficiency, which affects exclusively SNOs reduction without altering nitrotyrosine levels, results in a clinically relevant neuromuscular phenotype.

Conclusion: These findings provide novel insights into the involvement of GSNOR and S-nitrosylation in neuromuscular atrophy and neuropathic pain that are associated with pathological states; for example, diabetes and cancer.


Figures

<b>FIG. 1.</b>
FIG. 1.
S-nitrosylation extent and skeletal muscle mass in GSNOR-KO mice. (A) Evaluation of protein S-nitrosothiols (PSNOs) amount in total homogenates of tibialis anterior of 2-month-old GSNOR-KO (KO) and wild-type (WT) mice, subjected to biotin-switch assay and revealed by incubation with horseradish peroxidase (HRP)-conjugated streptavidin. Lactate dehydrogenase (LDH) was selected as a loading control from a set of elective “housekeeping” proteins on the basis of the coherence between immune-reactive band signal and nitrocellulose Ponceau-Red staining. (B) Western blot analyses of neuronal nitric oxide synthase (nNOS), inducible NOS (iNOS), and endothelial NOS (eNOS) performed in tibialis anterior homogenates. LDH was selected as a loading control. (C) Representative fluorescence microscopy images of tibialis anterior sections from KO, WT, and dystrophin-null (mdx) mice on staining with anti-nNOS (green), and DAPI (blue) to highlight nuclei. Scale bar, 40 μm. (D) Representative H&E stained sections of gastrocnemius of KO and wild-type WT mice. Centro-nucleated myofibers areas including small-sized fibers are indicated (arrowheads and white dotted lines, respectively). Scale bar, 100 μm. (E) Representative picture displaying paws detail of KO and WT mice. Dotted areas, muscle volume of WT legs. (F) Weight measures of tibialis anterior and gastrocnemius on tendon-to-tendon isolation from KO and WT mice. Results shown are the means±SEM of n=6 animals for each group, and the indicated p-value was calculated with regard to WT. (G) Overall body weight of KO and WT mice. Results shown are the means±SEM of n=6 animals for each group, and the indicated p-value was calculated with regard to WT. To see this illustration in color, the reader is referred to the web version of this article at www.liebertpub.com/ars
<b>FIG. 2.</b>
FIG. 2.
Size and composition of myofibers of skeletal muscle from GSNOR-KO mice. (A) Representative fluorescence microscopy images of tibialis anterior sections from 2-month-old GSNOR-KO (KO) and wild-type (WT) mice on staining with anti-laminin, anti-slow myosin heavy chain (slow MyHC), and DAPI to highlight myofibers boundaries, oxidative fibers, and nuclei, respectively. (B) Quantification of fiber cross-sectional area (CSA) in tibialis anterior from KO and WT mice. Results shown are the means±SEM of n=6 animals for each group. **p<0.01 calculated with regard to WT. (C) Representative fluorescence microscopy images of soleus sections from KO and WT mice on staining with anti-laminin and anti-slow MyHC to highlight myofiber boundaries and oxidative fibers, respectively. Scale bar: 100 μm (A, C). Quantification of total (D) and slow MyHC-containing (E) fiber cross-sectional area (CSA) in soleus from KO and WT mice. Results shown are the means±SEM of n=6 animals for each group. ***p<0.001 calculated with regard to WT. (F) Grip test: Evaluation of time that WT and KO mice gripped the grid by both hind and fore legs (left panel). Mice that gripped the grip within the cut-off time of 300 s and kept the grip for a further 10 s were recorded as a “success.” Percentage of success is reported in the right panel. Results shown are the means±SEM of n=33 animals divided into three different groups. **p<0.01 calculated with regard to WT. (G) Tail suspension test: Average time to the first episode of leg retraction. Results shown are the means±SEM of n=15 animals divided into three different groups and monitored thrice. ***p<0.001 calculated with regard to WT. To see this illustration in color, the reader is referred to the web version of this article at www.liebertpub.com/ars
<b>FIG. 3.</b>
FIG. 3.
Atrophy-related gene expression in mouse models of GSNOR deficiency and muscular dystrophies. Quantitative real-time PCR analyses of Atrogin1 (A), MuRF1 (B) in gastrocnemius of GSNOR-KO (KO) and wild-type (WT) mice at 2 months (2 mo) and 12 months (12 mo) of age. Results shown are the means±SEM of n=12 animals for each group. *p<0.05; **p<0.01; and ***p<0.001 calculated with regard to WT. (C) Western blot analyses of nNOS, iNOS, and eNOS performed in tibialis anterior homogenates of mdx, KO, and WT mice at 2 and 12 months of age. LDH was selected as a loading control. (D) Quantitative real-time PCR analyses of GSNOR in gastrocnemius of 2-month-old mdx, KO, and WT mice. Results shown are the means±SEM of n=4 animals for each group. p-value is calculated with regard to WT (E) Evaluation of protein S-nitrosothiols (PSNOs) amount in total homogenates of tibialis anterior of 2-month-old KO, mdx, α-Sarcoglycan null (α-SG−/−), and WT mice, subjected to biotin-switch assay, and revealed by incubation with HRP-conjugated streptavidin. LDH was selected as a loading control. Densitometry of each lane intensity is relativized to LDH and expressed as arbitrary units. Densitometry of immune-reactive bands: Values shown are the means±SD of n=3 different experiments. **p<0.01; ***p<0.001 calculated with regard to WT.
<b>FIG. 4.</b>
FIG. 4.
Mitochondrial morphology and autophagy in skeletal muscle of GSNOR-KO mice. (A) Electron micrographs of gastrocnemius from GSNOR-KO (KO) and wild-type (WT) mice in basal conditions and after physical exercise. Several abnormal mitochondria (black arrowheads) are present in myofibers of KO mice in standard condition and after physical exercise (panels d and h). Mit, mitochondria. After treadmill exercise, autophagosomes (white arrowheads) are detected in WT and KO mice. Higher magnification images show two bona fide autopagosomes (*) (B) Representative fluorescence microscopy images of myotubes derived from KO and WT mice on staining with anti-Grp75 to highlight mitochondria. Scale bar, 10 μm and 5 μm for the enlarged view. The quantification of the mean area of a mitochondrion was assessed by CellProfiler software. Values shown are the means±SD of n=3 different experiments. ***p<0.001 calculated with regard to WT. (C) Western blot analyses of p62, Atg7, and LC3 (I and II stand for the unlipidated/inactive, and lipidated/active autophagosome-bound form of the protein, respectively) performed in tibialis anterior homogenates. LDH was selected as a loading control. (D) Quantitative real-time PCR analyses of LC3B performed in gastrocnemius KO and WT. Results shown are the means±SEM of n=8 animals for each group. **p<0.01 calculated with regard to WT. To see this illustration in color, the reader is referred to the web version of this article at www.liebertpub.com/ars
<b>FIG. 5.</b>
FIG. 5.
Mitochondrial autophagy and dynamics in GSNOR-KO models. (A) Representative fluorescence microscopy images of myotubes derived from GSNOR-KO (KO) and wild-type (WT) mice carrying GFP-LC3 in heterozygosis on staining with anti-p62 antibody (red). Colocalization between LC3 and p62-positive spots are indicated (white arrowhead or dotted circle). Scale bar, 10 μm. (B) Western blot analyses of Opa1 and Drp1 performed in tibialis anterior homogenates. LDH was selected as a loading control. (C) Representative fluorescence microscopy images of myotubes derived from KO and WT mice, incubated or not with 5 mM N-acetylcysteine (NAC) for 4 h on staining with JC-1. Scale bar, 100 μm. (D) Representative fluorescence microscopy images of myotubes derived from KO and WT mice incubated or not with 5 mM NAC for 2 h on staining with antibodies anti-p62 (red) and anti-Grp75 to visualize mitochondria (green), and DAPI for nuclei (blue). Scale bar, 10 μm. To see this illustration in color, the reader is referred to the web version of this article at www.liebertpub.com/ars
<b>FIG. 6.</b>
FIG. 6.
Nitroxidative status of skeletal muscle of GSNOR-KO mice. (A) Western blot analyses of nitrotyrosines (Tyr-NO2) performed in tibialis anterior homogenates from GSNOR-KO (KO) and wild-type (WT) mice. LDH was selected as a loading control. (B) Representative fluorescence microscopy images of tibialis anterior sections from KO and WT mice on staining with anti-Tyr-NO2. Scale bar, 40 μm. White arrowheads: blood vessels. (C) Representative sections of tibialis anterior of KO and WT mice stained with Schmrol ferric-ferricyanide reduction to highlight lipofuscin aggregates. Protein precipitates are indicated (black arrowheads). Scale bar, 40 μm. (D) Western blot analyses of Catalase, Cu-Zn superoxide dismutase (Sod1), and Mg superoxide dismutase (Sod2) performed in tibialis anterior homogenates. LDH was selected as a loading control. Densitometry of immunoreactive bands: Values shown are the means±SD of n=3 different experiments. **p<0.01 calculated with regard to WT. (E) Western blot analyses of protein carbonyls performed in tibialis anterior homogenates from WT and KO mice. LDH was selected as a loading control. (F) Western blot analyses of Nrf2 performed in total and nuclear and cytosolic enriched fractions of tibialis anterior from WT and KO mice. Sod1 and LaminA/C were selected as loading and purity controls of cytosol and nuclei, respectively. (G) Immunoprecipitation of Keap1 revealed by Western blot against p62 (*, aspecific bands). (H) Quantitative real-time PCR analyses of NADH:quinone oxidoreductase 1 (Nqo1) in gastrocnemius of KO and WT mice at 2 months of age. Results shown are the means±SEM of n=6 animals for each group. p-value is calculated with regard to WT. To see this illustration in color, the reader is referred to the web version of this article at www.liebertpub.com/ars
<b>FIG. 7.</b>
FIG. 7.
Phospho-AMPK/FoxO3 pathway and apoptosis in skeletal muscle of GSNOR-KO mice. (A) Western blot analyses of phosphorylated AMPK (P-AMPK) and FoxO3 performed in tibialis anterior homogenates from GSNOR-KO (KO) and wild-type (WT) mice. LDH was selected as a loading control. (B) Western blot analyses of FoxO3 performed in nuclear and cytosolic-enriched fractions of tibialis anterior. LDH and histone 2B (H2B) were selected as loading and purity controls. Densitometry of immnoreactive bands: Values shown are the means±SD of n=3 different experiments relativized to their loading control and calculated as % of WT. (C) Western blot analyses of Bnip3 performed in tibialis anterior homogenates. LDH was selected as a loading control. (D) Quantitative real-time PCR analyses of Bnip3 performed in gastrocnemius KO and WT. Results shown are the means±SEM of n=8 animals for each group. **p<0.01 calculated with regard to WT. (E) Western blot analyses of cytochrome c (Cyt c) performed in mitochondrial and cytosolic-enriched fractions of tibialis anterior. LDH and Grp75 were selected as loading and purity controls. Densitometry of immnoreactive bands: values shown are the means±SD of n=3 different experiments relativized to their loading control and calculated as% of WT. (F) Apoptotic (TUNEL+) nuclei calculated in 2-month-old KO and WT mice. Results shown are the means±SD of n=8 animals for each group. ***p<0.001 calculated with regard to WT. (G) Representative fluorescence microscopy images of tibialis anterior sections from KO and WT mice on TUNEL reaction (to visualize apoptotic nuclei), and staining with anti-laminin and DAPI to highlight myofiber boundaries and nuclei, respectively. Arrowheads: apoptotic nuclei. Scale bar, 40 μm. (H) Western blot analyses of full-length and cleaved polyADP-ribose polymerase 1 (PARP1) performed in KO and WT myotubes. High exposure has been set up to visualize cleaved immune-reactive bands. LDH was selected as a loading control. To see this illustration in color, the reader is referred to the web version of this article at www.liebertpub.com/ars
<b>FIG. 8.</b>
FIG. 8.
Axonal damage and neuropathic pain in GSNOR-KO mice. (A) Representative Masson's Trichrome stained sections from sciatic nerve of wild-type (WT) (a, c) and GSNOR-KO (KO) (b, d) mice. (a, c) Section of wild-type mice sciatic nerve revealing high number of axons and thick myelin sheath. (b, d) Section of KO mice sciatic nerve showing a reduction of axons, regression of myelin, and clustered small myelinated fibers that are indicative of massive regeneration (arrowheads). (c, d) 2.5-fold magnification of (a, b), respectively Measurement of mechano-allodynia (B) and thermal hyperalgesia (C) of KO and WT mice. Results shown are the means±SEM of n=10 animals for each group, and the indicated p-value was calculated with regard to WT. To see this illustration in color, the reader is referred to the web version of this article at www.liebertpub.com/ars
<b>FIG. 9.</b>
FIG. 9.
Delay of muscle regeneration in GSNOR-KO mice. Representative H&E stained sections from tibialis anterior of wild-type (WT) (a, c, e) and GSNOR-KO (KO) (b, d, f) mice at 3 (a, b) and 8 (c–f) days after cardiotoxin (CTX) injection-induced injury. (a, b) Acute muscle damage revealing massive inflammatory infiltration and degenerating muscles in WT as well as in KO mice. (c) Semi-complete regeneration process at a later stage in wild-type mice. (e) Enlarged view of (c) showing a few regenerating centro-nucleated myofibers with dimensions comparable with undamaged fibers (arrows). (d) Damaged tibialis anterior of KO mice, showing a remarkable delay in the regenerative capability. (f) Enlarged view of (d) presenting a large portion of small centro-nucleated muscle fibers (arrowhead) surrounded by abundant extracellular matrix accompanied still by a few inflammatory cells (asterisk). Scale bar: 400 μm (a–d) and 100 μm (e, f). To see this illustration in color, the reader is referred to the web version of this article at www.liebertpub.com/ars

References

    1. Allaire J, Maltais F, LeBlanc P, Simard PM, Whittom F, Doyon JF, Simard C, and Jobin J. Lipofuscin accumulation in the vastus lateralis muscle in patients with chronic obstructive pulmonary disease. Muscle Nerve 25: 383–389, 2002 - PubMed
    1. Altamirano F, López JR, Henríquez C, Molinski T, Allen PD, and Jaimovich E. Increased resting intracellular calcium modulates NF-κB-dependent inducible nitric-oxide synthase gene expression in dystrophic mdx skeletal myotubes. J Biol Chem 287: 20876–20887, 2012 - PMC - PubMed
    1. Andersson DC, Betzenhauser MJ, Reiken S, Meli AC, Umanskaya A, Xie W, Shiomi T, Zalk R, Lacampagne A, and Marks AR. Ryanodine receptor oxidation causes intracellular calcium leak and muscle weakness in aging. Cell Metab 14: 196–207, 2011 - PMC - PubMed
    1. Barreiro E, Comtois AS, Gea J, Laubach VE, and Hussain SN. Protein tyrosine nitration in the ventilatory muscles: role of nitric oxide synthases. Am J Respir Cell Mol Biol 26: 438–446, 2002 - PubMed
    1. Beal MF, Ferrante RJ, Browne SE, Matthews RT, Kowall NW, and Brown RH., Jr Increased 3-nitrotyrosine in both sporadic and familial amyotrophic lateral sclerosis. Ann Neurol 42: 644–654, 1997 - PubMed

Publication types

MeSH terms