. 2014 Mar 31:13:74.
doi: 10.1186/1476-4598-13-74.

Prostate tumor OVerexpressed-1 (PTOV1) down-regulates HES1 and HEY1 notch targets genes and promotes prostate cancer progression

Affiliations

Prostate tumor OVerexpressed-1 (PTOV1) down-regulates HES1 and HEY1 notch targets genes and promotes prostate cancer progression

Lide Alaña et al. Mol Cancer. .

Abstract

Background: PTOV1 is an adaptor protein with functions in diverse processes, including gene transcription and protein translation, whose overexpression is associated with a higher proliferation index and tumor grade in prostate cancer (PC) and other neoplasms. Here we report its interaction with the Notch pathway and its involvement in PC progression.

Methods: Stable PTOV1 knockdown or overexpression were performed by lentiviral transduction. Protein interactions were analyzed by co-immunoprecipitation, pull-down and/or immunofluorescence. Endogenous gene expression was analyzed by real time RT-PCR and/or Western blotting. Exogenous promoter activities were studied by luciferase assays. Gene promoter interactions were analyzed by chromatin immunoprecipitation assays (ChIP). In vivo studies were performed in the Drosophila melanogaster wing, the SCID-Beige mouse model, and human prostate cancer tissues and metastasis. The Excel package was used for statistical analysis.

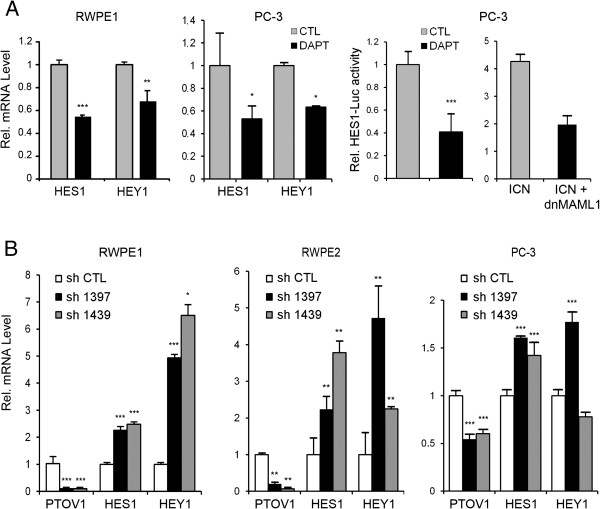
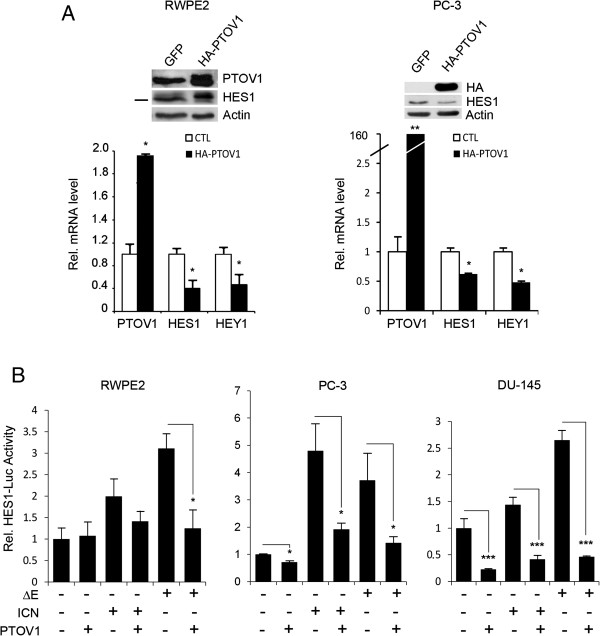
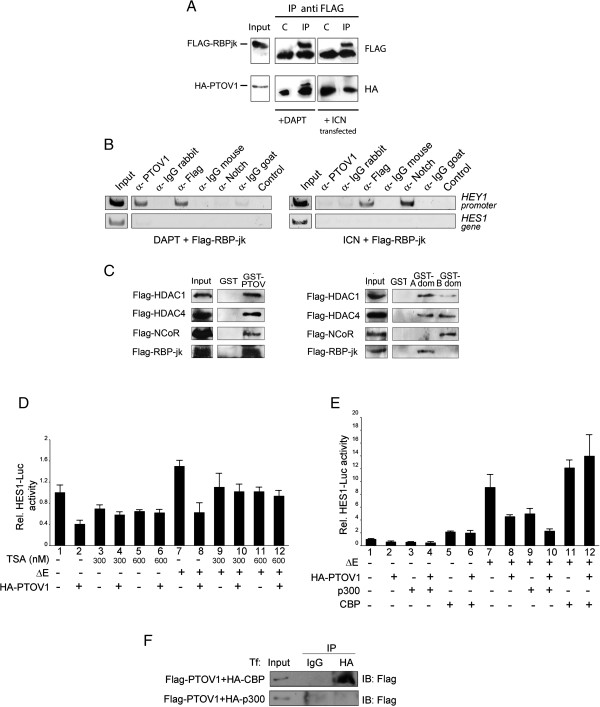
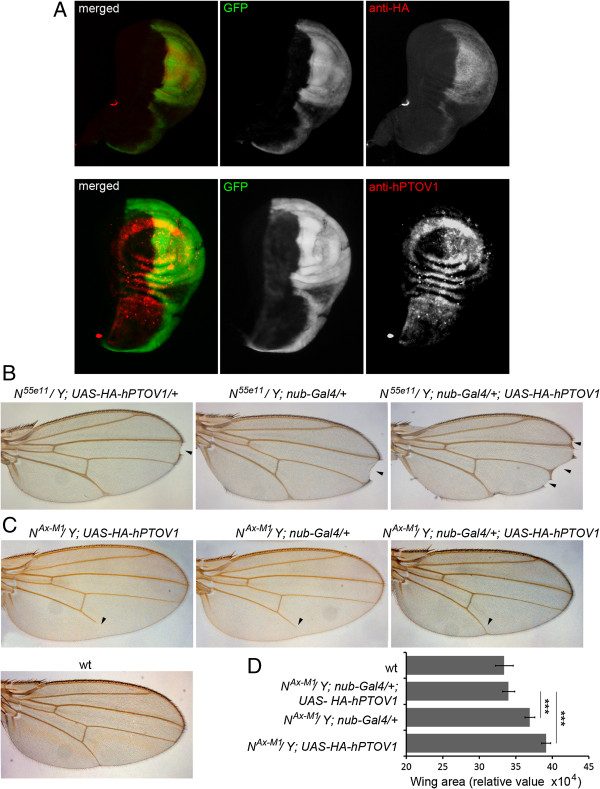
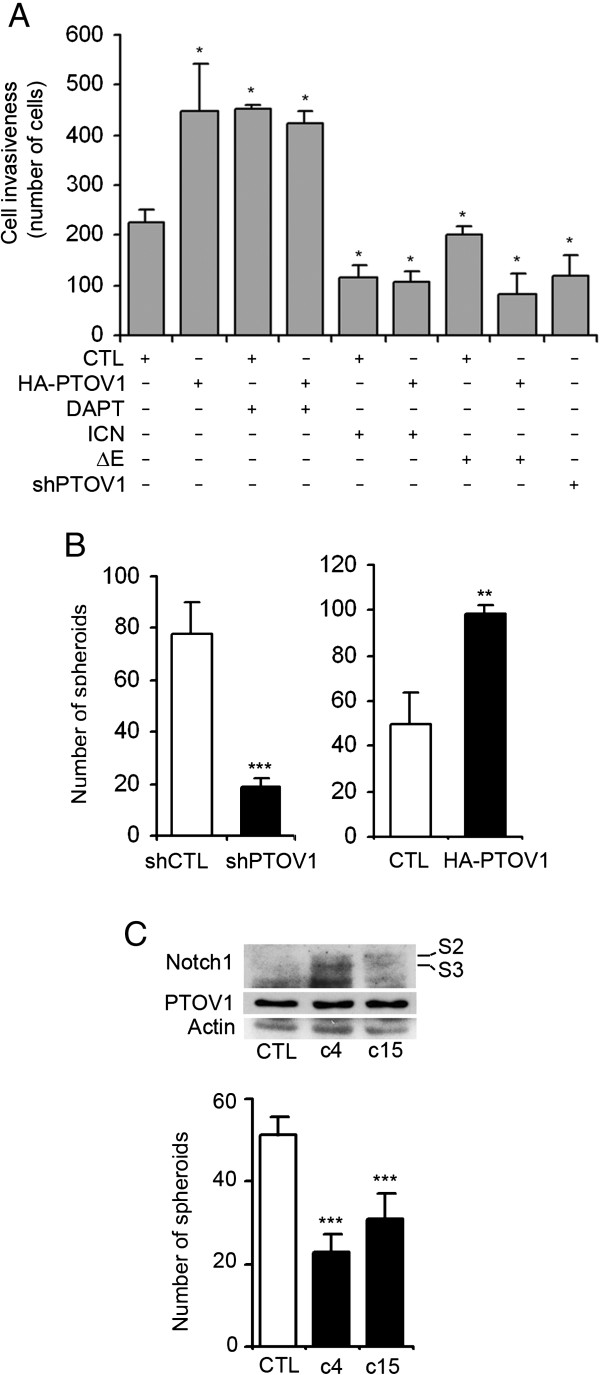
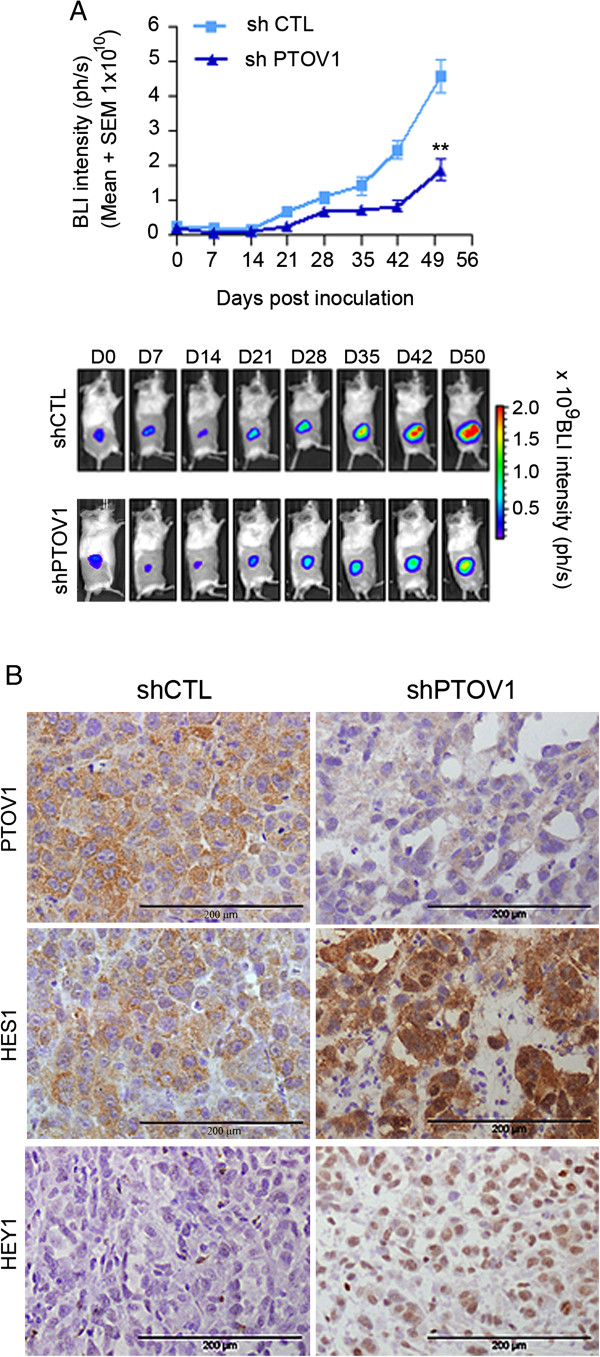
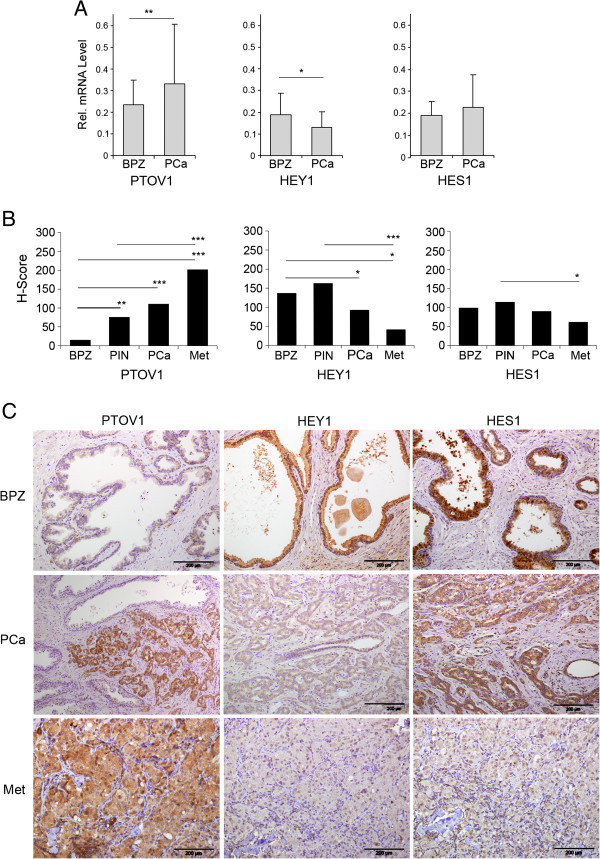
Results: Knockdown of PTOV1 in prostate epithelial cells and HaCaT skin keratinocytes caused the upregulation, and overexpression of PTOV1 the downregulation, of the Notch target genes HEY1 and HES1, suggesting that PTOV1 counteracts Notch signaling. Under conditions of inactive Notch signaling, endogenous PTOV1 associated with the HEY1 and HES1 promoters, together with components of the Notch repressor complex. Conversely, expression of active Notch1 provoked the dismissal of PTOV1 from these promoters. The antagonist role of PTOV1 on Notch activity was corroborated in the Drosophila melanogaster wing, where human PTOV1 exacerbated Notch deletion mutant phenotypes and suppressed the effects of constitutively active Notch. PTOV1 was required for optimal in vitro invasiveness and anchorage-independent growth of PC-3 cells, activities counteracted by Notch, and for their efficient growth and metastatic spread in vivo. In prostate tumors, the overexpression of PTOV1 was associated with decreased expression of HEY1 and HES1, and this correlation was significant in metastatic lesions.

Conclusions: High levels of the adaptor protein PTOV1 counteract the transcriptional activity of Notch. Our evidences link the pro-oncogenic and pro-metastatic effects of PTOV1 in prostate cancer to its inhibitory activity on Notch signaling and are supportive of a tumor suppressor role of Notch in prostate cancer progression.


Figures

Figure 1
Figure 1
Modulation of HES1 and HEY1 expression by Notch signaling and PTOV1 in prostate cell lines. (A) The transcription of HES1 and HEY1 genes in RWPE1 and PC-3 cells is modulated by the γ-secretase inhibitor DAPT. Cells were treated with DAPT or solvent (CTL) for 4 days and HES1 or HEY1 transcript levels quantified by real-time RT-PCR. Right: The HES1 promoter is modulated by DAPT and by the negative dominant-MAML1 (dnMAML1). PC-3 cells, transfected with HES-luciferase and TK-Renilla, were either treated with DAPT or co-transfected with ICN and ICN plus dnMAML1 and firefly luciferase activity, normalized to Renilla, determined. (B) Knockdown of PTOV1 in RWPE and PC-3 prostate cells by shRNAs causes the upregulation of HES1 and HEY1 mRNA. Cells were transduced with shRNA1397 and shRNA1439 lentiviruses and analyzed by real-time RT-PCR. Values were normalized to RPS14 and for relative values in cells bearing control shRNA.
Figure 2
Figure 2
Ectopic overexpression of PTOV1 downregulates endogenous HEY1 and HES1. (A) Cells were transduced with lentivirus for HA-PTOV1 (black bars) or control lentivirus (white bars) and analyzed for the expression of HES1 and HEY1 by real-time RT-PCR. Inlet: Western blotting for the detection of ectopic HA-PTOV1 (slower migrating band in transduced cells) and endogenous HES1. (B) The transcriptional repressor activity of PTOV1 is downstream of Notch receptor processing. PC-3 cells, transfected with the HES-luciferase and TK-Renilla reporter plasmids, were co-transfected with ΔE (partially processed) or ICN (fully processed) forms of Notch1 without, or with HA-PTOV1, and transactivation of the HES1-promoter determined by luciferase assays. Statistical significance: * p < 0.05, ** p < 0.005.
Figure 3
Figure 3
PTOV1 interacts with RBP-Jκ and the Notch repressor complex at the HEY1 promoter and its repressive function requires HDACs activity and it is restrained by CBP. (A) PTOV1 interacts with RBP-Jκ. PC-3 cells, transfected with FLAG-RBP-Jκ and HA-PTOV1, were co-transfected with ICN or treated with DAPT for 4 days. Cell lysates were immunoprecipitated with FLAG antibody or control IgG and blots were revealed with anti-HA antibody. (B) Endogenous PTOV1 occupies the endogenous HEY1 promoter under conditions of Notch signaling inhibition. PC-3 cells, transfected with FLAG-RBP-Jκ, were treated with DAPT (left) or co-transfected with ICN (right). Chromatin was immunoprecipitated with antibodies to PTOV1, FLAG, Notch1, or non-specific IgGs. Associated DNA fragments were analyzed by PCR with primers specific for HEY1 promoter regions. Primers from intragenic regions of the HES1 gene were used as a specificity control. (C) PTOV1 interacts with the Notch repressor complex. FLAG-HDAC1, FLAG-HDAC4, FLAG-NCoR and FLAG-RBP-Jκ were separately transfected into PC-3 cells and tested for interaction with GST-PTOV1 (left panel) or GST-A domain, GST-B domain (right panel) or control GST beads. Bound proteins were analyzed by Western blotting with anti-FLAG. (D) PTOV1 repressor activity requires HDACs activity. Cells, transfected with HES1-luciferase, Renilla and the plasmids indicated, were treated with the HDAC inhibitor trichostatin A (TSA) for 48 h. Lysates were used in transactivation assays for firefly luciferase activity (E) Overexpression of the CBP acetyl-transferase, but not p300, overcomes the repressor activity of PTOV1 on the HES1 promoter. Cells, transfected with p300 or CBP plus the indicated plasmids, were used in HES1-driven luciferase transactivation assays. (F) PTOV1 interacts with CBP but not with p300. Lysates from cells transfected with FLAG -PTOV1 and HA-CBP (top), or HA-p300 (bottom), were immunoprecipitated with antibody to HA, or control IgG, and analyzed by Western blotting.
Figure 4
Figure 4
PTOV1 antagonizes Notch activity in the Drosophila wing. (A) Expression of hPTOV1 in engrailed-Gal4UAS-GFP; UAS-HA-hPTOV1 wing imaginal discs. To confirm the activity of the transgene, the ectopic expression of hPTOV1 from the UAS-HA-hPTOV1 was examined. The engrailed-Gal4 line, which drives UAS-transgene expression only in the posterior compartment of the wing disc, allows to compare the levels of expression in anterior versus posterior compartments in the same tissue (imaginal disc). The expression of the transgene was observed by (1) co-activation of a UAS-GFP, (2) immuno detection of HA and (3) antibodies to PTOV1. Absence of staining in the anterior (left) half of the disc contrasts with positive staining in the posterior (right) half, demonstrating the ectopic expression of PTOV1 driven by engrailed-Gal4. (B) Overxpression of hPTOV1 exacerbates the effects of loss-of-function (LOF) of Notch. Notch LOF allele N55e11 causes a notch at the wing edge (arrowhead, left and middle panels) that is exacerbated by expression of hPTOV1 (arrowheads, right panel). (C) Expression of hPTOV1 suppresses the effects of Notch gain-of-function (GOF). The GOF Notch allele NAx-M1 causes defects in the L5 vein (arrowhead, left and middle panels), suppressed by expression of hPTOV1 (arrowhead, right panel). A wild type (wt) wing is shown as control. (D) Histogram showing the quantification of the wing areas for each genotype (n > 30) (*** p < 0.0005).
Figure 5
Figure 5
HA-PTOV1 overexpression promotes invasion and anchorage-independent growth of PC-3 cells in contrast to the effects of exogenous Notch1 expression. (A) PTOV1 induces in vitro cell invasion, in contrast to the inhibition caused by Notch1. PC-3 cells were transiently transfected with 5 μg of the indicated plasmids and/or 5μg of DNA carrier (CTL) and treated with DAPT or solvent for three days before trypsinization and plating on Matrigel-coated Transwell wells. After 24 h, invading cells were stained with Hoechst and scored. Short hairpin sh1397 was used to knockdown PTOV1 expression. Assays were performed in triplicate in at least two independent experiments. (B) PTOV1 promotes anchorage-independent growth of PC-3 cells. Cells stably knocked down for PTOV1 grew significantly fewer spheroids than control cells. In contrast, cells stably expressing HA-PTOV1 formed significantly more spheroids than cells transduced with control lentivirus. (C) Notch1 overexpression significantly decreases anchorage-independent growth of PC-3 cells. Independent clones c4 and c15, with stable expression of Notch1 as shown by Western blotting, formed significantly fewer spheroids than control cells transfected with control pcDNA3 vector. S2 and S3 indicate partial and active forms of Notch1 receptor. * p < 0.05, ** p < 0.005, *** p < 0.0005.
Figure 6
Figure 6
Knockdown of PTOV1 in prostate cancer cells inhibits tumor growth and metastasis of PC-3 cells in immunodeficient mice. (A) PTOV1 is required for optimal tumor formation of PC-3 cells in vivo. PC-3 cells with integrated luciferase gene (3 x10⁶), knocked down for PTOV1 (n = 5) by sh1397 or control lentivirus (n = 5), were implanted subcutaneously into the right flank of SCID-beige male mice and monitored by in vivo bio-luminescent imaging. Mean values + SEM are displayed. Statistically significant differences in the growth of knockdown vs. control cells were observed. ** p = 0.001. (B) Immunohistochemistry of explanted tumors. A strongly decreased expression of PTOV1 is detected in tumors formed by shPTOV1 cells vs shControl derived tumors. In contrast, tumors derived from shPTOV1 cells express high levels of HES1 and HEY1 proteins compared to shControl and grew metasases at significantly later times (p = 0.001) as compared to control cells.
Figure 7
Figure 7
PTOV1 displays expression patterns reciprocal to those of HEY1 and HES1 in benign prostate, primary prostate carcinoma and metastasis. (A) PTOV1 transcripts levels increases from normal prostate to primary prostate cancer samples, while HEY1 expression declines from normal to neoplastic tissues. mRNA from 43 prostate adenocarcinomas (PCa) and their corresponding benign epithelial glands from the peripheral zone (BPZ) were analyzed by real-time PCR using specific primers and probes for HES1, HEY1 or PTOV1. Values represent mean + SEM of mRNA expression relative to RPS14 control. PTOV1 levels are significantly increased in PCa compared to BPZ. HEY1 levels in BPZ are significantly decreased in PCa. A significant inverse correlation between the expression levels of HEY1 and PTOV1 is evidenced (Pearson coefficient = 0.87). (B) The expression levels of PTOV1, as determined by immunohistochemistry, increases along with metastatic progression of PCa, while expression levels of HEY1 and HES1 declines with progression. Protein expression levels were assigned semiquantitative values by the Hscore method in benign epithelium (BPZ), pre-malignant HGPIN lesions, PCa, and 16 lymph node metastasis (Met). (C) Representative images from immunohistochemical staining of serial sections from PCa and metastasis (Met) with specific antibodies to HEY1, HES1 or PTOV1. Slides were counterstained with hematoxylin. PTOV1 staining is low or undetectable in BPZ, and strong expression is observed in PCa and Met. HES1 and HEY1 show strong staining in benign epithelial glands in BPZ and HGPINs. A significantly decreased staining intensity is observed for HEY1 in cancerous areas of PCa and metastasis, relative to BPZ. Staining intensity for HES1 is comparable between epithelial glands of BPZ, HGPIN and cancerous areas of PCa, but the intensity is significantly weaker in metastases (Met). Bars indicate average Hscore values.* p < 0.05, ** p < 0.005,*** p < 0.0005.

References

    1. Benedit P, Paciucci R, Thomson TM, Valeri M, Nadal M, Caceres C, de Torres I, Estivill X, Lozano JJ, Morote J, Reventos J. PTOV1, a novel protein overexpressed in prostate cancer containing a new class of protein homology blocks. Oncogene. 2001;20(12):1455–1464. doi: 10.1038/sj.onc.1204233. - DOI - PubMed
    1. Welsh JB, Sapinoso LM, Su AI, Kern SG, Wang-Rodriguez J, Moskaluk CA, Frierson HF Jr, Hampton GM. Analysis of gene expression identifies candidate markers and pharmacological targets in prostate cancer. Cancer Res. 2001;61(16):5974–5978. - PubMed
    1. Lapointe J, Li C, Higgins JP, van de Rijn M, Bair E, Montgomery K, Ferrari M, Egevad L, Rayford W, Bergerheim U, Ekman P, DeMarzo AM, Tibshirani R, Botstein D, Brown PO, Brooks JD, Pollack JR. Gene expression profiling identifies clinically relevant subtypes of prostate cancer. Proc Natl Acad Sci U S A. 2004;101(3):811–816. doi: 10.1073/pnas.0304146101. - DOI - PMC - PubMed
    1. Santamaria A, Fernandez PL, Farre X, Benedit P, Reventos J, Morote J, Paciucci R, Thomson TM. PTOV-1, a novel protein overexpressed in prostate cancer, shuttles between the cytoplasm and the nucleus and promotes entry into the S phase of the cell division cycle. Am J Pathol. 2003;162(3):897–905. doi: 10.1016/S0002-9440(10)63885-0. - DOI - PMC - PubMed
    1. Ramaswamy S, Tamayo P, Rifkin R, Mukherjee S, Yeang CH, Angelo M, Ladd C, Reich M, Latulippe E, Mesirov JP, Poggio T, Gerald W, Loda M, Lander ES, Golub TR. Multiclass cancer diagnosis using tumor gene expression signatures. Proc Natl Acad Sci U S A. 2001;98(26):15149–15154. doi: 10.1073/pnas.211566398. - DOI - PMC - PubMed

Publication types

MeSH terms