. 2014 Apr 1:14:83.
doi: 10.1186/1471-2229-14-83.

Identification of candidate genes for drought tolerance by whole-genome resequencing in maize

Affiliations

Identification of candidate genes for drought tolerance by whole-genome resequencing in maize

Jie Xu et al. BMC Plant Biol. .

Abstract

Background: Drought stress is one of the major limiting factors for maize production. With the availability of maize B73 reference genome and whole-genome resequencing of 15 maize inbreds, common variants (CV) and clustering analyses were applied to identify non-synonymous SNPs (nsSNPs) and corresponding candidate genes for drought tolerance.

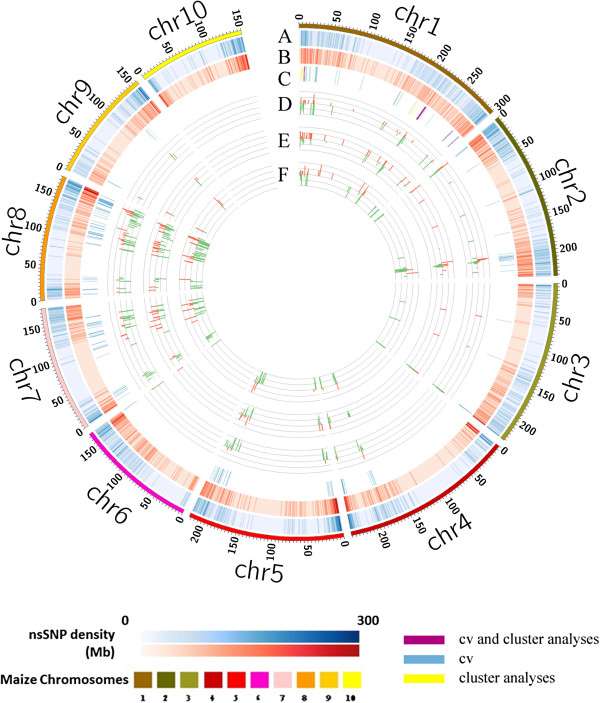
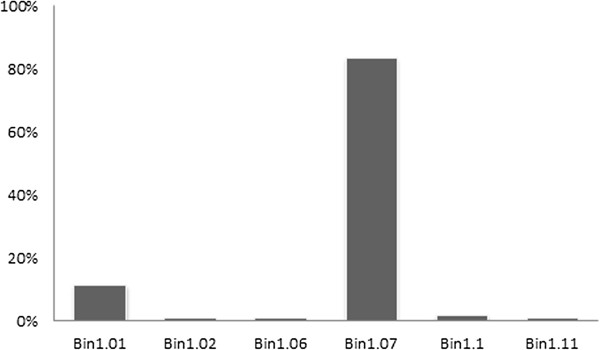
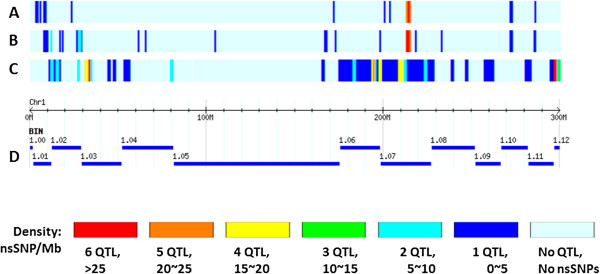
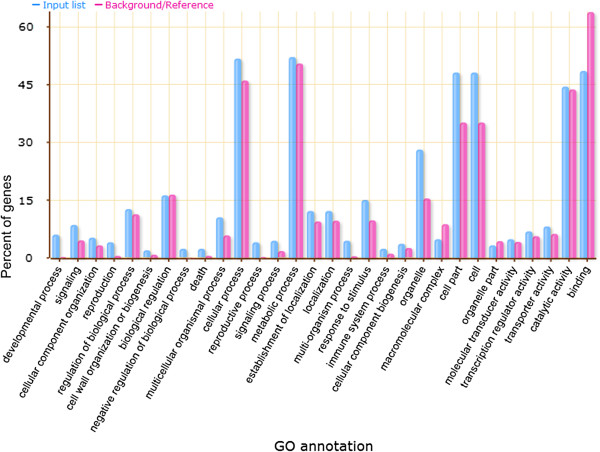
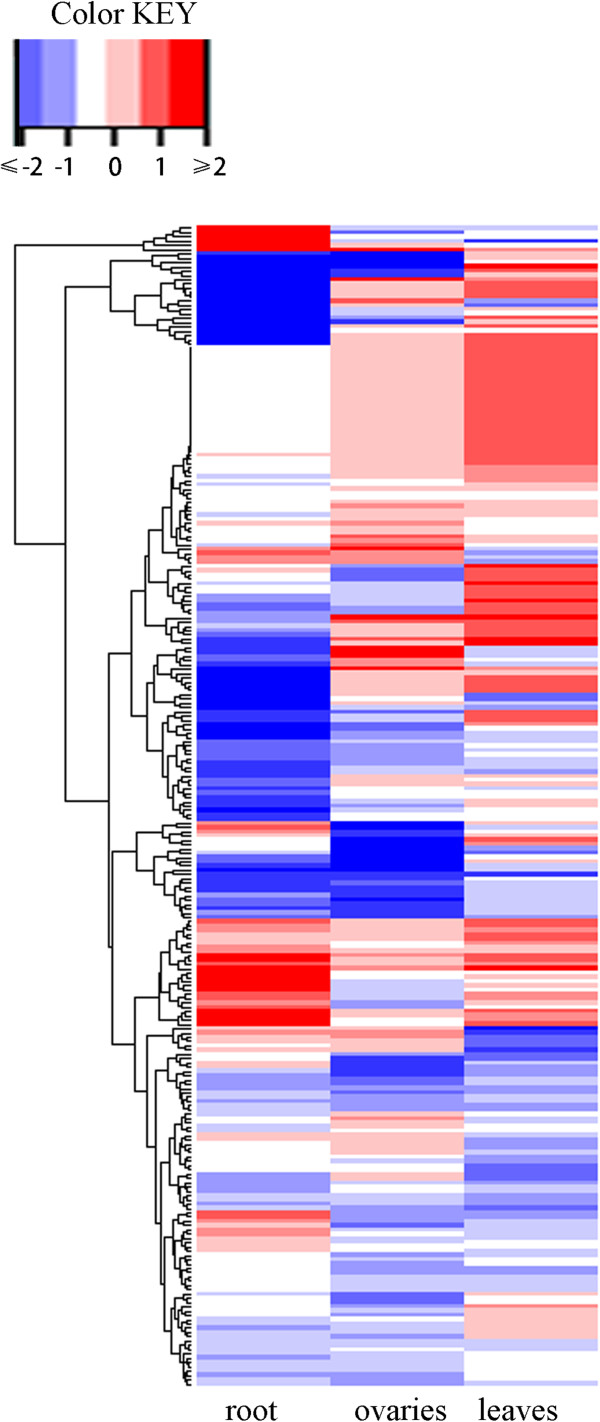
Results: A total of 524 nsSNPs that were associated with 271 candidate genes involved in plant hormone regulation, carbohydrate and sugar metabolism, signaling molecules regulation, redox reaction and acclimation of photosynthesis to environment were detected by CV and cluster analyses. Most of the nsSNPs identified were clustered in bin 1.07 region that harbored six previously reported QTL with relatively high phenotypic variation explained for drought tolerance. Genes Ontology (GO) analysis of candidate genes revealed that there were 35 GO terms related to biotic stimulus and membrane-bounded organelle, showing significant differences between the candidate genes and the reference B73 background. Changes of expression level in these candidate genes for drought tolerance were detected using RNA sequencing for fertilized ovary, basal leaf meristem tissue and roots collected under drought stressed and well-watered conditions. The results indicated that 70% of candidate genes showed significantly expression changes under two water treatments and our strategies for mining candidate genes are feasible and relatively efficient.

Conclusions: Our results successfully revealed candidate nsSNPs and associated genes for drought tolerance by comparative sequence analysis of 16 maize inbred lines. Both methods we applied were proved to be efficient for identifying candidate genes for complex traits through the next-generation sequencing technologies (NGS). These selected genes will not only facilitate understanding of genetic basis of drought stress response, but also accelerate genetic improvement through marker-assisted selection in maize.


Figures

Figure 1
Figure 1
Distribution of nsSNPs and associated genes on maize chromosomes. Concentric circles showed aspects of the genome. Density of common nsSNPs identified in drought-tolerant maize inbreds (A) and in drought-sensitive maize inbreds (B). Genome mapping of candidate nsSNPs identified by common variants method (C). The fold change of expression level for candidate genes in ovaries (D), leaves (E) and roots (F) under water-stressed conditions compared with well-watered conditions. For Figure C, different colors indicate different strategies as shown at the bottom of right corner. For Figures D, E and F, red and green bars represent up- and down- regulated expression, respectively.
Figure 2
Figure 2
The cluster regions of candidate nsSNPs for drought tolerance on chromosome 1 identified by cluster analysis. X-axis represents the bin regions where the clustered nsSNPs located and Y-axis represents the percentages of nsSNPs identified by cluster analysis in each bin region on maize chromosome 1.
Figure 3
Figure 3
Biplot display of chosen variants on chromosome 1 in three extremely drought tolerance inbreds (LX9801, Qi319 and Tie7922) and three extremely drought sensitive inbreds (Ye478, Ji853 and B73). The clustered nsSNPs on chromosome 1 were selected to make the Biplot by transforming the nsSNPs into a (0, 1) matrix. Then the Singular Value Decomposition (SVD) was applied to the matrix with V matrix (for nsSNPs) and G matrix (for materials) returned. The first two vectors of each matrix were used to make X-axis and Y-axis. The blue dotted lines indicate the vectors of the six inbred lines and red round dots represent the chosen variants on chromosome 1.
Figure 4
Figure 4
The densities of candidate nsSNPs by both CV and cluster analyses and reported QTL on chromosome 1 for drought tolerance. The densities of candidate nsSNPs identified by cluster analysis (A) and CV analysis (B) and reported QTL (C) on chromosome 1 for drought tolerance. (D) represents genetic distances and bin regions on chromosome 1.
Figure 5
Figure 5
Flash bar chart of over represented terms for drought-tolerant candidate genes in biological process category. The Y-axis is the percentage for the input genes in different GO terms calculated by the number of genes mapped to the GO terms divided by the number of all input genes. The same calculation was applied to the reference list to generate its percentage. These two lists are represented using different custom colors. The X -axis is the definition of GO terms.
Figure 6
Figure 6
Clustering of candidate genes according to their changed expression levels in water-stress condition. The color scale shown on the top left represents the changed gene expression values (Log2 fold change) under water-stressed condition. “roots”, “ovaries” and “leaves” column present the tested genes in the roots, ovaries and the basal leaves, respectively. The dose red and blue colors represent up-and down-regulated expression, respectively.
Figure 7
Figure 7
High resolution melting analysis (HRM) of PCR amplicons for gene GRMZM2G467339 in 16 maize inbreds. Red and green curves indicate SNP loci A and G, respectively.

Similar articles

Cited by

References

    1. Yang S, Vanderbeld B, Wan J, Huang Y. Narrowing down the targets: towards successful genetic engineering of drought-tolerant crops. Mol Plant. 2010;3(3):469–490. doi: 10.1093/mp/ssq016. - DOI - PubMed
    1. Ribaut J-M, Betran J, Monneveux P, Setter T. In: Handbook of Maize: Its Biology. Bennetzen Jeff L, Hake Sarah C, editor. New York: Springer; 2009. Drought tolerance in maize; pp. 311–344.
    1. Boyer J, Westgate M. Grain yields with limited water. J Exper Botany. 2004;55(407):2385–2394. doi: 10.1093/jxb/erh219. - DOI - PubMed
    1. Shinozaki K, Yamaguchi-Shinozaki K. Gene networks involved in drought stress response and tolerance. J Exper Botany. 2007;58(2):221–227. - PubMed
    1. Lu Y, Zhang S, Shah T, Xie C, Hao Z, Li X, Farkhari M, Ribaut JM, Cao M, Rong T. Joint linkage–linkage disequilibrium mapping is a powerful approach to detecting quantitative trait loci underlying drought tolerance in maize. Proc Natl Acad Sci. 2010;107(45):19585–19590. doi: 10.1073/pnas.1006105107. - DOI - PMC - PubMed

Publication types

MeSH terms

LinkOut - more resources