Review
. 2014 Jul 31:107:71-82.
doi: 10.1016/j.jprot.2014.03.021. Epub 2014 Mar 29.

MALDI imaging mass spectrometry: spatial molecular analysis to enable a new age of discovery

Affiliations
Review

MALDI imaging mass spectrometry: spatial molecular analysis to enable a new age of discovery

Megan M Gessel et al. J Proteomics. .

Abstract

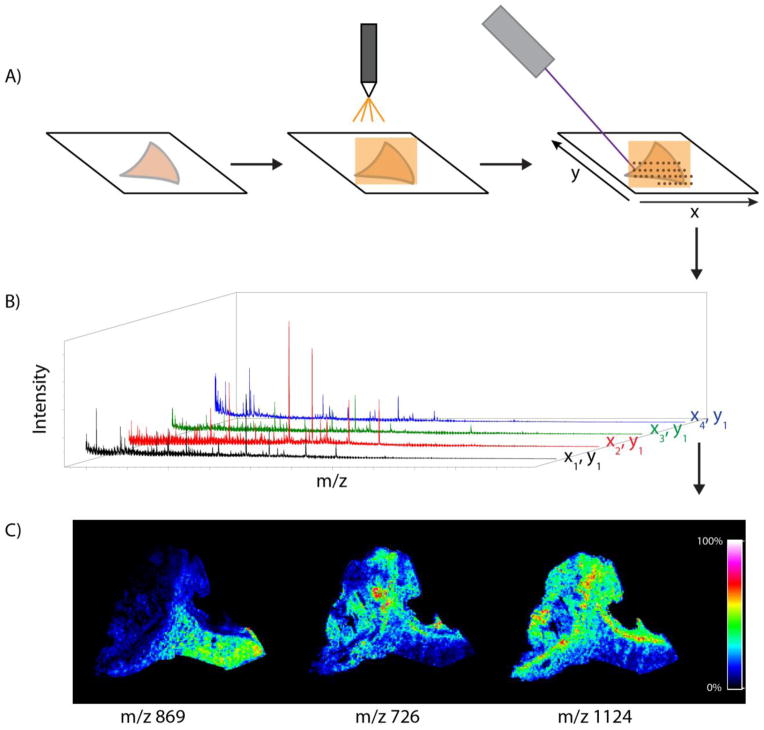
Matrix-assisted laser desorption/ionization imaging mass spectrometry (MALDI IMS) combines the sensitivity and selectivity of mass spectrometry with spatial analysis to provide a new dimension for histological analyses to provide unbiased visualization of the arrangement of biomolecules in tissue. As such, MALDI IMS has the capability to become a powerful new molecular technology for the biological and clinical sciences. In this review, we briefly describe several applications of MALDI IMS covering a range of molecular weights, from drugs to proteins. Current limitations and challenges are discussed along with recent developments to address these issues. This article is part of a Special Issue entitled: 20years of Proteomics in memory of Viatliano Pallini. Guest Editors: Luca Bini, Juan J. Calvete, Natacha Turck, Denis Hochstrasser and Jean-Charles Sanchez.

Keywords: MALDI imaging mass spectrometry.


Conflict of interest statement

Conflict of Interest

The authors declare no conflict of interest.

Figures

Figure 1
Figure 1
Overview of the MALDI IMS workflow on a section of a human kidney biopsy. (A) Fresh frozen tissue is cut and mounted on a conductive surface. Matrix is applied by a robotic sprayer or is sublimated, and the section is irradiated by the laser in a raster array. (C) Mass spectra are acquired for each x,y coordinate. (D) Selected ions may be mapped on the tissue surface to create images.
Figure 2
Figure 2
Publications reporting the development and application of IMS through 2013. Data was collected from a PubMed search of the following key words: (imaging mass spectrometry OR mass spectrometry imaging)) AND (“1980”[Date - Publication]: “2013”[Date - Publication])).
Figure 3
Figure 3
Images of the membrane protein myelin proteolipid protein (PLP, 30 kDa). Special sample preparation protocols were developed to enable imaging of membrane proteins [10]. The protein was imaged within cerebrum (left) and cerebellum/medulla (right). Exclusive localization to white matter regions of brain, particularly to the corpus callosum (Cc), caudate-putamen (Cp), and septal nucleus (Sn) of the cerebrum and the arbor vitae (Arb) of the cerebellum and the entire medulla (Med), is apparent.
Figure 4
Figure 4
Target MALDI IMS analysis of synaptophysin (m/z 323) and somatostatin (m/z 532) in single islet cells. Images were obtained using a transmission geometry ion source for high-resolution imaging. (a) Optical image of islet cells. (b) MALDI IMS of an immunoreactive islet cell for synaptophysin. (c) Targeted IMS of a delta cell for synaptophysin (green) and somatostatin (red), showing different localization for each molecule within different cellular structures. [16]
Figure 5
Figure 5
Images of separated and identified isobaric ions of tubulin and ubiquitin tryptic peptide fragments (1039 m/z) in rat brain were imaged using ion mobility spectrometry coupled with imaging mass spectrometry. For these images, two different drift times have been selected: 100–127 and 133–148 bins to reconstruct the respective images. Without any ion mobility, one image is obtained corresponding to the superposition of these two images. [34]
Figure 6
Figure 6
Comparison of imaging results of mouse brain serial sections with matrix pre- and post-coated targets at different spatial resolutions. Ion images were collected in negative ion mode. Tentative identification was based on previous MS/MS analyses of lipids at these masses in mouse brain. Below: H&E optical scanned images from a serial section are shown at the bottom of the figure.
Figure 7
Figure 7
Quantitative analysis of a rat liver section dosed with the drug nevirapine (m/z 267.124) using a mimetic tissue model. (A) Optical scan of sections from the nevirapine-dosed rat liver (left) and the mimetic tissue model (right), before matrix application. (B) Ion image for nevirapine, m/z 267.124, at 75% maximum intensity threshold. (C) Comparison of nevirapine quantification results from the MALDI IMS and LC-MS analyses.

Similar articles

Cited by

References

    1. de Godoy LMF, Olsen JV, Cox J, Nielsen ML, Hubner NC, Froehlich F, et al. Comprehensive mass-spectrometry-based proteome quantification of haploid versus diploid yeast. Nature. 2008;455:1251–U60. - PubMed
    1. Lamond AI, Uhlen M, Horning S, Makarov A, Robinson CV, Serrano L, et al. Advancing Cell Biology Through Proteomics in Space and Time. Molecular & Cellular Proteomics. 2012:11. - PMC - PubMed
    1. Hebert AS, Richards AL, Bailey DJ, Ulbrich A, Coughlin EE, Westphall MS, et al. The One Hour Yeast Proteome. Molecular & Cellular Proteomics. 2014;13:339–47. - PMC - PubMed
    1. Caprioli RM, Farmer TB, Gile J. Molecular imaging of biological samples: Localization of peptides and proteins using MALDI-TOF MS. Analytical Chemistry. 1997;69:4751–60. - PubMed
    1. Stoeckli M, Chaurand P, Hallahan DE, Caprioli RM. Imaging mass spectrometry: A new technology for the analysis of protein expression in mammalian tissues. Nature Medicine. 2001;7:493–6. - PubMed

MeSH terms