. 2014 Apr 15;74(8):2295-305.
doi: 10.1158/0008-5472.CAN-13-1803. Epub 2014 Mar 31.

IGF-I regulates redox status in breast cancer cells by activating the amino acid transport molecule xC-

Affiliations

IGF-I regulates redox status in breast cancer cells by activating the amino acid transport molecule xC-

Yuzhe Yang et al. Cancer Res. .

Abstract

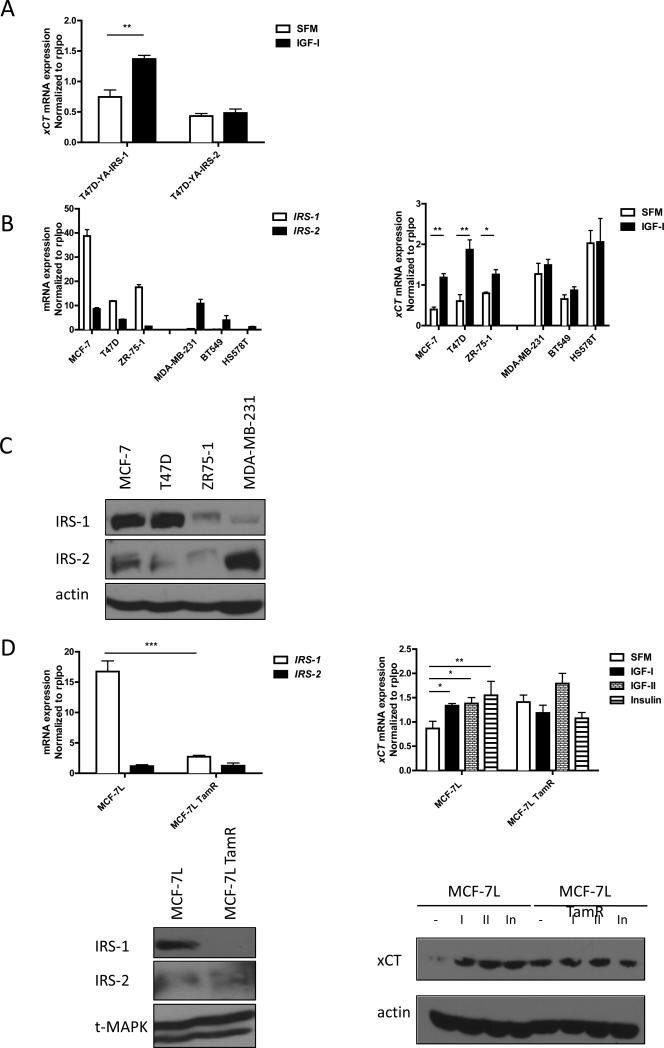
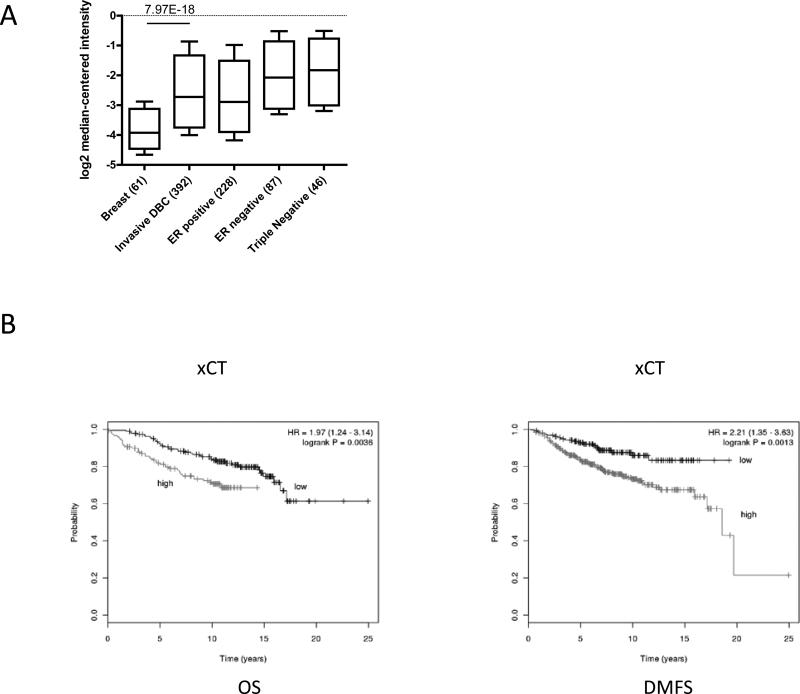
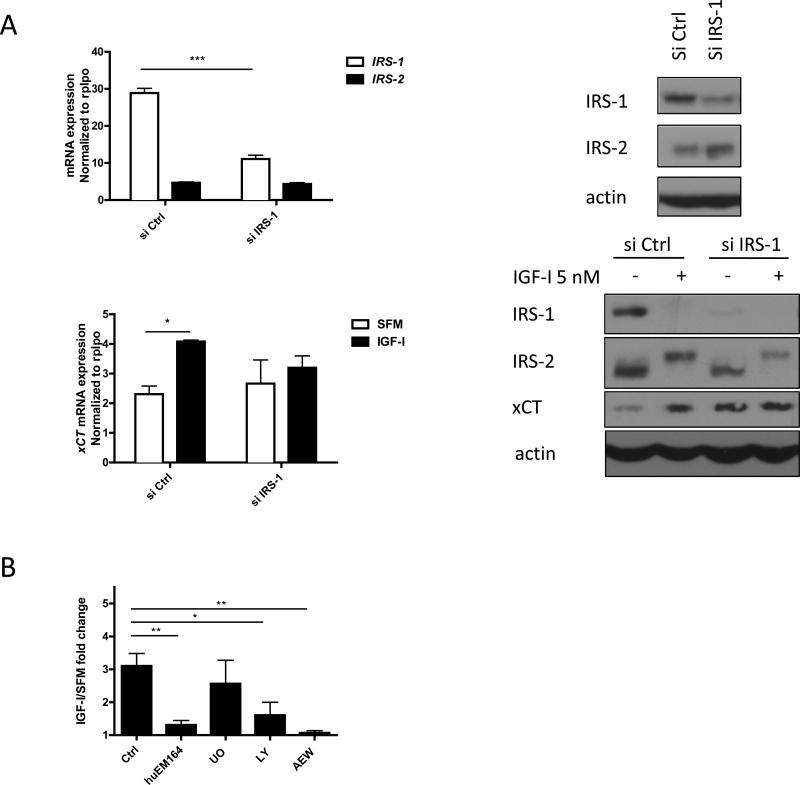
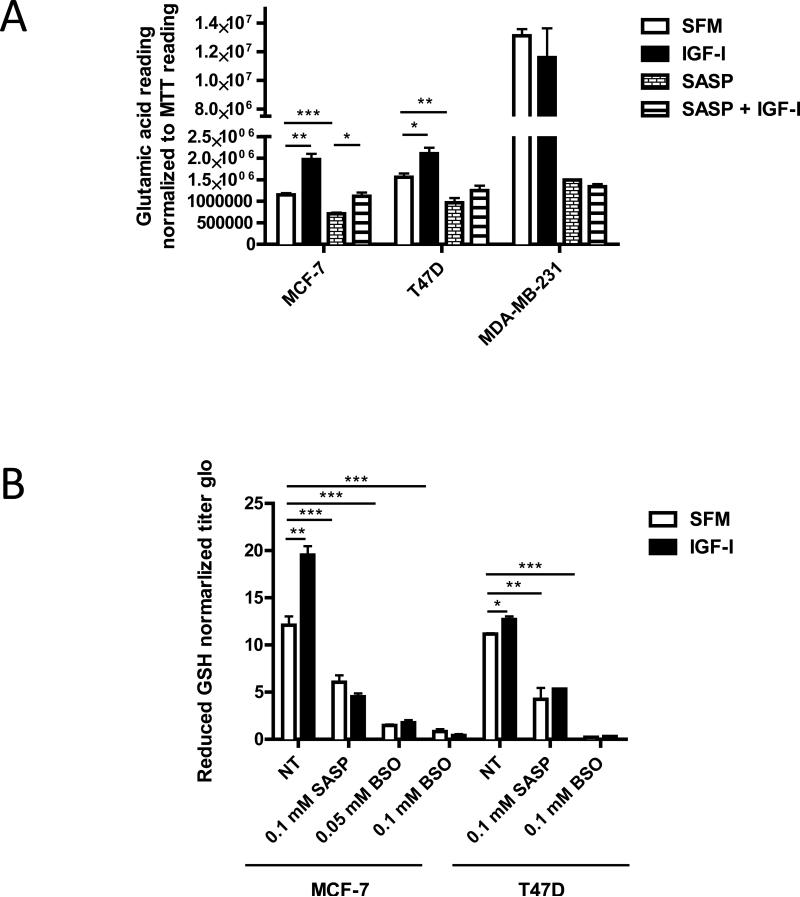
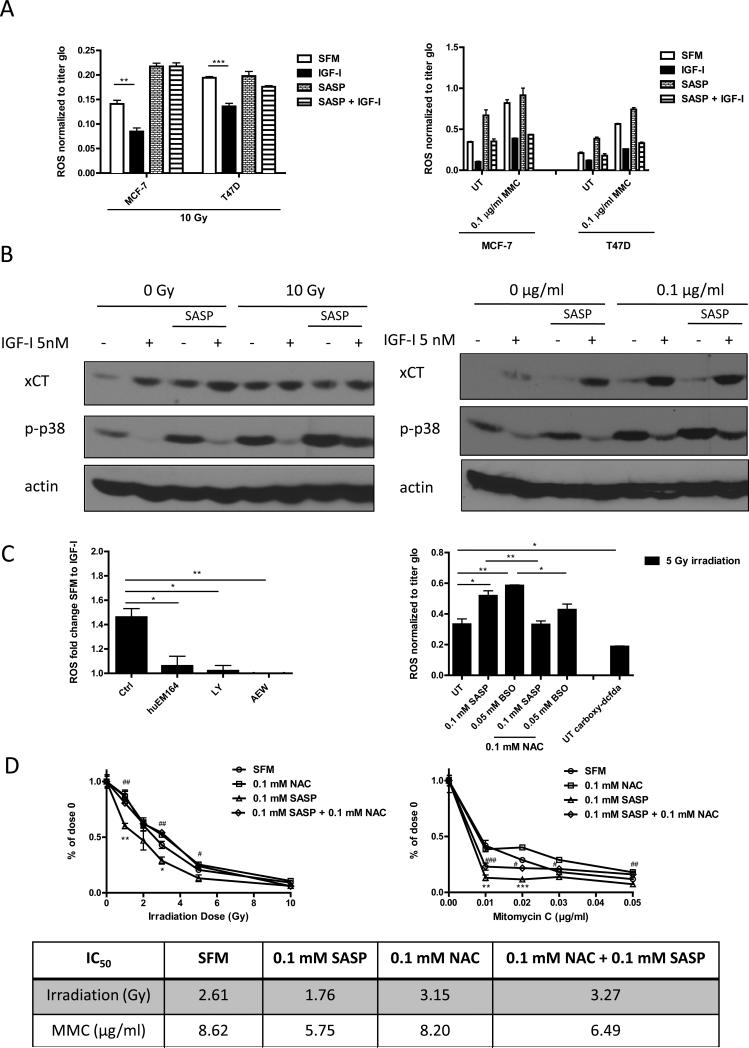
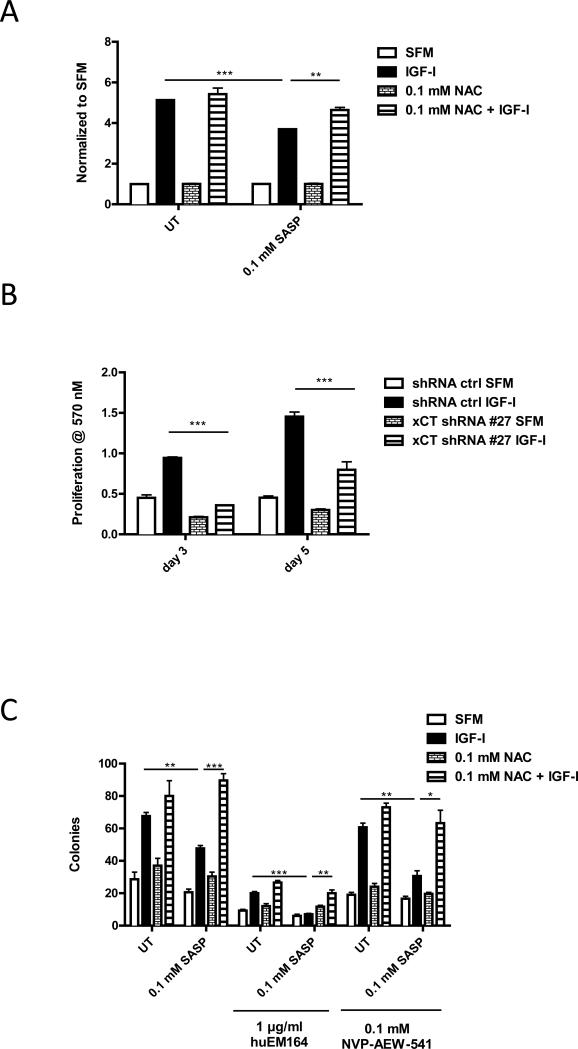
Insulin-like growth factors (IGF) stimulate cell growth in part by increasing amino acid uptake. xCT (SLC7A11) encodes the functional subunit of the cell surface transport system xC(-), which mediates cystine uptake, a pivotal step in glutathione synthesis and cellular redox control. In this study, we show that IGF-I regulates cystine uptake and cellular redox status by activating the expression and function of xCT in estrogen receptor-positive (ER(+)) breast cancer cells by a mechanism that relies on the IGF receptor substrate-1 (IRS-1). Breast cancer cell proliferation mediated by IGF-I was suppressed by attenuating xCT expression or blocking xCT activity with the pharmacologic inhibitor sulfasalazine (SASP). Notably, SASP sensitized breast cancer cells to inhibitors of the type I IGF receptor (IGF-IR) in a manner reversed by the reactive oxygen species (ROS) scavenger N-acetyl-L-cysteine. Thus, IGF-I promoted the proliferation of ER(+) breast cancer cells by regulating xC(-) transporter function to protect cancer cells from ROS in an IRS-1-dependent manner. Our findings suggest that inhibiting xC(-) transporter function may synergize with modalities that target the IGF-IR to heighten their therapeutic effects.


Figures

Figure 1
Figure 1. IGF-I induced xCT mRNA expression in an IRS-1 dependent manner in breast cancer cell lines
(A) T47D-YA-IRS-1 and Y47D-YA-IRS-2 cells were grown in SFM for 24 h. After 4 h of IGF-I (5 nM) exposure, mRNA was isolated and analyzed by qRT-PCR. mRNA expression of xCT was normalized to the RPLPO housekeeper gene. (B) Left: mRNA expression of IRS-1 and IRS-2 in ER positive cell lines: MCF-7, T47D, and ZR-75-1; ER negative breast cancer cell lines: MDA-MB-231, BT549, and HS578T were analyzed by qRT-PCR. Right: mRNA expression of xCT in SFM or 4 hours after IGF-I exposure was analyzed by qRT-PCR. (C) Immunoblot analysis of the expression levels of IRS-1 and IRS-2 in indicated breast cancer cell lines. (D) mRNA expression of IRS-1 and IRS-2 in full growth media were analyzed in MCF-7L and MCF-7L TamR cells (upper panels left). Right: mRNA expression of xCT in MCF-7L and MCF-7L TamR cells after 4 h of IGF-I (5 nM), IGF-II (10 nM), or insulin (10 nM) exposure. Lower panels right: IRS-1 and IRS-2 protein expression in MCF-7L and MCF-7L TamR cells in full growth media condition. xCT expression in MCF-7L and MCF-7L TamR after 24 h of ligand stimulation was analyzed by immunoblot (right panel). Data are presented as mean ± standard error of the mean (SEM); all results are representative of three independent replicates.
Figure 2
Figure 2. xCT is overexpressed breast tumor and associated with poor prognosis in ER positive breast cancer
(A) Oncomine output data was sorted to isolate specified associations as indicated and reported as the mRNA copy number unit expression values for normal breast, invasive ductal breast carcinoma, ER positive breast carcinoma, ER negative breast carcinoma, and triple negative breast carcinoma samples using box-and-whiskers plots (whiskers: 90/10 percentiles, box: 75/25 percentiles, line: median of all samples). (B) Kaplan-Meier plots of OS (left) and DMFS (right) of ER positive breast cancer patients with high or low expression of xCT. Data obtained from the Kaplan-Meier plotter database.
Figure 3
Figure 3. IGF-I induced xCT mRNA and protein expression specifically through IRS-1 and via PI3K dependent pathway in MCF-7 cells
(A) MCF-7 cells were transfected with either 30 nM of control or IRS-1 siRNA for 48h. siRNA knockdown efficiency was determined by both qRT-PCR (upper left) and immunoblot analysis (upper right). Cells then were grown in SFM for 24 h followed by IGF-I (5 nM) stimulation for 4 h for mRNA measurement (lower left) and 24 h for protein detection (lower right). (B) MCF-7 cells were grown in SFM for 24 h and pretreated with huEM164 (20 μg/ml) for 24 h; pretreated with 10 UO126 (UO; 10 μM), LY294002 (LY; 10 μM), or NVP AEW-541 (AEW; 0.5 μM) for 30 min. Cells were then treated with IGF-I for 4 h for qRT-PCR. Data are mean ± SEM; all qRT-PCR results are representative of at least three independent triplicates-experiments.
Figure 4
Figure 4. IGF-I stimulated xC− transporter function in ER positive breast cancer cells
Cells were pretreated with SASP (0.1 mM) for 48 h, BSO (0.05 or 0.1 mM) for 24 h. (A) MCF-7, T47D, and MDA-MB-231 cells were grown in SFM for 24 h then treated with indicated treatments with or without IGF-I (5nM) for another 24 h. Culture media glutamic acid levels were analyzed and readings were normalized to MTT reading. (B) MCF-7 and T47D cells were grown in SFM for 24 h then treated with indicated treatments with or without IGF-I (5nM) for another 24 h. Intracellular reduced GSH concentration was determined as described. Data are mean ± SEM; all results are representative of three independent replicates.
Figure 5
Figure 5. IGF-I regulated intracellular ROS level via xC transporter and through PI3K dependent pathway in ER positive breast cancer cells
(A) MCF-7 and T47D cells were pretreated with or without SASP (0.1 mM) for 48 h, grown in SFM for 24h, treated with IGF-I (5 nM) for another 24h, and then irradiated (10 Gy, left panel) or treated with mitomycin C treatment (1 μg/ml for ROS assay; 0.1 μg/ml for immunoblot) for 3 days (right panel). Intracellular ROS levels were measured as described. (B) Cellular phospho-p38MAPK level was determined by immunoblot. (C) MCF-7 cells were grown in SFM, pretreated huEM164 (20 μg/ml), LY294002 (10 μM), or NVP AEW-541 (0.5 μM) (Left panel). MCF-7 cells were pretreated with indicated dosage of SASP, BSO, or NAC. Acute ROS were induced by 5 gy irradiation. MCF-7 cells incubated with ROS insensitive probe carboxy-DCFDA (0.1 mM) was presented as assay control (Right panel). Cellular ROS levels were determined as described. (D) MCF-7 cells were treated with indicated treatments in soft agar. After 24h of synchronization in SFM condition, cells were either irradiated or treated with mitomycin C. Colony formation was assessed after 14 days. Survival rate curve was determined by normalizing colony number of each treatment to its own no treatment control. Statistically significant differences are noted (* or # p<0.5, ** or ## p<0.01, *** or ### p<0.001). IC50 values were shown in the table. Data are mean ± SEM; all results are representative of three independent replicates.
Figure 6
Figure 6. Disruption of xC transporter function resulted in partial suppression in IGF-I-induced cell proliferation and sensitized cells to IGF-IR inhibitors
(A) MCF-7 cells were first pretreated with SASP (0.1 mM) for 48 h or NAC (0.1 mM) for 24 h in SFM and then treated with IGF-I (5 nM) for 5 days. Cell viability was determined by performing MTT assay. (B) MCF-7 cells were infected by either scrambled shRNA or xCT specific shRNA to generate stable xCT down-regulation clone. Cells were grown in SFM for 24h then treated with IGF-I (5 nM) for 3 days or 5 days. Cell monolayer growth was measured by MTT assay. (C) MCF-7 cells were treated with indicated treatment combinations. Anchorage independent growth was determined after 14 days. Data are mean ± SEM; all results are representative of three independent replicates.

Similar articles

Cited by

References

    1. Sachdev D, Yee D. The IGF system and breast cancer. Endocr Relat Cancer. 2001;8:197–209. - PubMed
    1. Pollak M. The insulin and insulin-like growth factor receptor family in neoplasia: an update. Nat Rev Cancer. 2012;12:159–69. - PubMed
    1. Taniguchi CM, Emanuelli B, Kahn CR. Critical nodes in signalling pathways: insights into insulin action. Nature reviews Molecular cell biology. 2006;7:85–96. - PubMed
    1. Jackson JG, White MF, Yee D. Insulin receptor substrate-1 is the predominant signaling molecule activated by insulin-like growth factor-I, insulin, and interleukin-4 in estrogen receptor-positive human breast cancer cells. J Biol Chem. 1998;273:9994–10003. - PubMed
    1. Byron SA, Horwitz KB, Richer JK, Lange CA, Zhang X, Yee D. Insulin receptor substrates mediate distinct biological responses to insulin-like growth factor receptor activation in breast cancer cells. Br J Cancer. 2006;95:1220–8. - PMC - PubMed

Publication types

MeSH terms