Review
. 2014 May;61(5):1364-79.
doi: 10.1109/TBME.2014.2313619. Epub 2014 Mar 25.

Magnetic resonance imaging at ultrahigh fields

Review

Magnetic resonance imaging at ultrahigh fields

Kamil Ugurbil. IEEE Trans Biomed Eng. 2014 May.

Abstract

Since the introduction of 4 T human systems in three academic laboratories circa 1990, rapid progress in imaging and spectroscopy studies in humans at 4 T and animal model systems at 9.4 T have led to the introduction of 7 T and higher magnetic fields for human investigation at about the turn of the century. Work conducted on these platforms has demonstrated the existence of significant advantages in SNR and biological information content at these ultrahigh fields, as well as the presence of numerous challenges. Primary difference from lower fields is the deviation from the near field regime; at the frequencies corresponding to hydrogen resonance conditions at ultrahigh fields, the RF is characterized by attenuated traveling waves in the human body, which leads to image nonuniformities for a given sample-coil configuration because of interferences. These nonuniformities were considered detrimental to the progress of imaging at high field strengths. However, they are advantageous for parallel imaging for signal reception and parallel transmission, two critical technologies that account, to a large extend, for the success of ultrahigh fields. With these technologies, and improvements in instrumentation and imaging methods, ultrahigh fields have provided unprecedented gains in imaging of brain function and anatomy, and started to make inroads into investigation of the human torso and extremities. As extensive as they are, these gains still constitute a prelude to what is to come given the increasingly larger effort committed to ultrahigh field research and development of ever better instrumentation and techniques.


Figures

Fig. 1
Fig. 1
(a): Early 4 T brain images published from Siemens [10], [11]. (b) 4 T MDEFT images of human brain obtained in CMRR [12], [13].
Fig. 2
Fig. 2
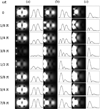
2-D plots of instantaneous transverse |B1 | at progressing points during a half period in phantoms with (a) σ = 0 S/m, (b) σ = 0.26 S/m, and (c) σ = 0.67 S/m. The intensity profiles along the horizontal centerlines are also shown on the right of the 2-D plots. The surface coil position is indicated by two small dots on the left side of the phantom. Since the temporal B1 strength varies greatly among these three cases, the signal intensities of temporal points are normalized individually for each conductivity condition in order to visualize the temporal change for all the conditions clearly [32].
Fig. 3
Fig. 3
Transmit B1 magnitude (color coded normalized intensity; see online version for color map) in a cylindrical “phantom” when the individual transmit B1 vectors from each channel are first experimentally determined and subsequently are added according to the constructs shown below each figure from an eight channel transmit and receive RF coil where experiments were performed transmitting one channel at a time and receiving with all channels [33]. The white ellipse in A depicts approximate boundaries of a human head.
Fig. 4
Fig. 4
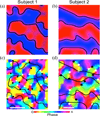
Functional maps of ocular dominance columns (a, b) and orientation columns (c, d) in the human brain obtained with SE fMRI at 7 T in two subjects (color coded; see online version for color Map). The black lines in (c), and (d) depict the boundaries of the ocular dominance columns seen in (a) and (b), respectively, so as to permit the visualization of the relationship between the two columnar organizations. The black and white dots in (c) and (d) identify the centers of clockwise and counterclockwise rotating pinwheels. The white bars (lower left hand corner in (c) and (d) designate 1 mm scale. From Yacoub et al. 2008 [74].
Fig. 5
Fig. 5
Multiband GRE EPI data acquired at 7 T with concurrent slice and in-plane (phase encode) acceleration (4 and 3 fold, respectively). Three orthogonal slices are shown from a 1-mm isotropic resolution whole brain data obtained with a 32 channel receive array and blipped CAIPI [140] field of view shift equivalent to FOV/3 (images provided by CMRR [118]).
Fig. 6
Fig. 6
A resting state network [the so-called default mode network (DMN)] (shown in color superimposed on anatomical images in gray scale). extracted using independent component analysis (ICA) from 1-mm isotropic resolution, whole-brain 7 T rfMRI time series. Three orthogonal planes from the whole brain data are shown. Data were acquired using standard GRE EPI without slice acceleration but with 4-fold acceleration along the in-plane phase encode direction. The DMN data in color is superimposed on 0.6-mm isotropic T1 weighted anatomical images obtained with MPRAGE at 7 T. Adapted from [156].
Fig. 7
Fig. 7
T2-weighted MR images of the head of hippocampus obtained at 7 T in a coronal slice, from a control subject (31-year-old male). Adapted from [160].
Fig. 8
Fig. 8
Susceptibility weighted imaging (SWI) at 9.4 T (left) and 3 T (right) in the human brain to depict venous anatomy (adapted from [103]).
Fig. 9
Fig. 9
Time-of-flight angiography at 7 T viewed as a maximum intensity, projection in the axial (two different subjects and methods, a and b) and sagittal (c) orientations. Data were obtained using multichannel transmit to improve spatial homogeneity of the RF pulses employed in the acquisition (a and c) versus the standard circularly polarized mode acquisition. Adapted from [55] and [181].
Fig. 10
Fig. 10
(a) Single slice body image reported from early 4 T experiments from the research laboratories of Siemens [1], [2]. (b) A contemporary 7 T image of a slice in the human torso, targeting imaging of the heart, obtained with a 16-channel transmit and receive array coil [48], [49], using B1 “shimming” (image provided by C. J. Synder, L. DeLaBarre, and T. Vaughan) (c) and (d) The transmit B1 magnitude map (normalized intensity, color coded) before (c) and after (d) optimization over the heart, demonstrating that the B1 is normally highly inhomogeneous and weak over this organ of interest (c), but can be improved significantly by multichannel transmit methods (d) [48], [49].
Fig. 11
Fig. 11
Sixteen channel pTx pulse design for a multiband RF pulse that excites two slices simultaneously in the human brain at 7 T. The L shaped curve quantifies tradeoffs, in this specific case, between total RF energy of the RF pulse and excitation errors [i.e., root mean square error (RMSE)]. The crossing between the horizontal and vertical dashed lines, labeled “Same fidelity” and “Same energy,” identify the performance of the same coil operated in a circularly polarized mode. Adapted from [64].

Similar articles

Cited by

  • From ultrahigh to extreme field magnetic resonance: where physics, biology and medicine meet.
    Niendorf T, Barth M, Kober F, Trattnig S. Niendorf T, et al. MAGMA. 2016 Jun;29(3):309-11. doi: 10.1007/s10334-016-0564-1. MAGMA. 2016. PMID: 27221262 No abstract available.
  • Design of an Electrically Automated RF Transceiver Head Coil in MRI.
    Sohn SM, DelaBarre L, Gopinath A, Vaughan JT. Sohn SM, et al. IEEE Trans Biomed Circuits Syst. 2015 Oct;9(5):725-32. doi: 10.1109/TBCAS.2014.2360383. Epub 2014 Oct 28. IEEE Trans Biomed Circuits Syst. 2015. PMID: 25361512 Free PMC article.
  • Germany's journey toward 14 Tesla human magnetic resonance.
    Ladd ME, Quick HH, Speck O, Bock M, Doerfler A, Forsting M, Hennig J, Ittermann B, Möller HE, Nagel AM, Niendorf T, Remy S, Schaeffter T, Scheffler K, Schlemmer HP, Schmitter S, Schreiber L, Shah NJ, Stöcker T, Uder M, Villringer A, Weiskopf N, Zaiss M, Zaitsev M. Ladd ME, et al. MAGMA. 2023 Apr;36(2):191-210. doi: 10.1007/s10334-023-01085-z. Epub 2023 Apr 8. MAGMA. 2023. PMID: 37029886 Free PMC article. Review.
  • 1.5 versus 3 versus 7 Tesla in abdominal MRI: A comparative study.
    Laader A, Beiderwellen K, Kraff O, Maderwald S, Wrede K, Ladd ME, Lauenstein TC, Forsting M, Quick HH, Nassenstein K, Umutlu L. Laader A, et al. PLoS One. 2017 Nov 10;12(11):e0187528. doi: 10.1371/journal.pone.0187528. eCollection 2017. PLoS One. 2017. PMID: 29125850 Free PMC article.
  • T1 and T2 measurements of the neonatal brain at 7 T.
    Mahmoud A, Tomi-Tricot R, Leitão D, Bridgen P, Price AN, Uus A, Boutillon A, Lawrence AJ, Cromb D, Cawley P, Deprez M, De Vita E, Giles SL, Rutherford MA, Edwards AD, Hajnal JV, Arichi T, Malik SJ. Mahmoud A, et al. Magn Reson Med. 2025 May;93(5):2153-2162. doi: 10.1002/mrm.30403. Epub 2024 Dec 13. Magn Reson Med. 2025. PMID: 39673110 Free PMC article.

References

    1. van der Kolk AG, Hendrikse J, Luijten PR. Ultrahigh-field magnetic resonance imaging: The clinical potential for anatomy, pathogenesis, diagnosis, and treatment planning in brain disease. Neuroimaging Clin. N Amer. 2012 May;22(2):343–362. - PubMed
    1. Umutlu L, Ladd ME, Forsting M, Lauenstein T. 7 Tesla MR imaging: Opportunities and challenges. Rofo. 2014 Feb;186(2):121–129. - PubMed
    1. Niendorf T, Sodickson DK, Krombach GA, Schulz-Menger J. Toward cardiovascular MRI at 7 T: Clinical needs, technical solutions and research promises. Eur. Radiol. 2010 Dec;20(12):2806–2816. - PMC - PubMed
    1. Niendorf T, Graessl A, Thalhammer C, Dieringer MA, Kraus O, Santoro D, Fuchs K, Hezel F, Waiczies S, Ittermann B, Winter L. Progress and promises of human cardiac magnetic resonance at ultra-high fields: a physics perspective. J. Magn. Reson. 2013 Apr;229:208–222. - PubMed
    1. Moser E, Stahlberg F, Ladd ME, Trattnig S. 7-T MR-from research to clinical applications? NMR Biomed. 2012 May;25(5):695–716. - PubMed

Publication types

MeSH terms