

The Andean adaptive toolkit to counteract high altitude maladaptation: genome-wide and phenotypic analysis of the Collas
- PMID: 24686296
- PMCID: PMC3970967
- DOI: 10.1371/journal.pone.0093314
The Andean adaptive toolkit to counteract high altitude maladaptation: genome-wide and phenotypic analysis of the Collas
Abstract
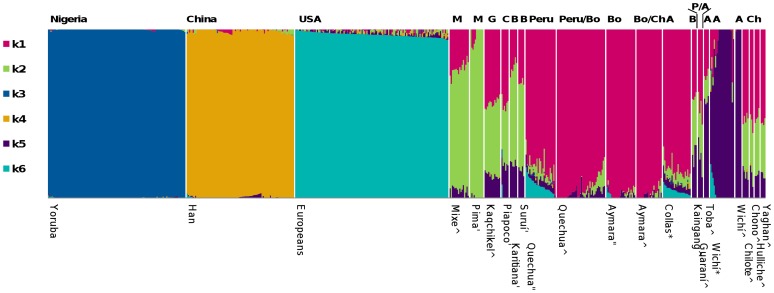
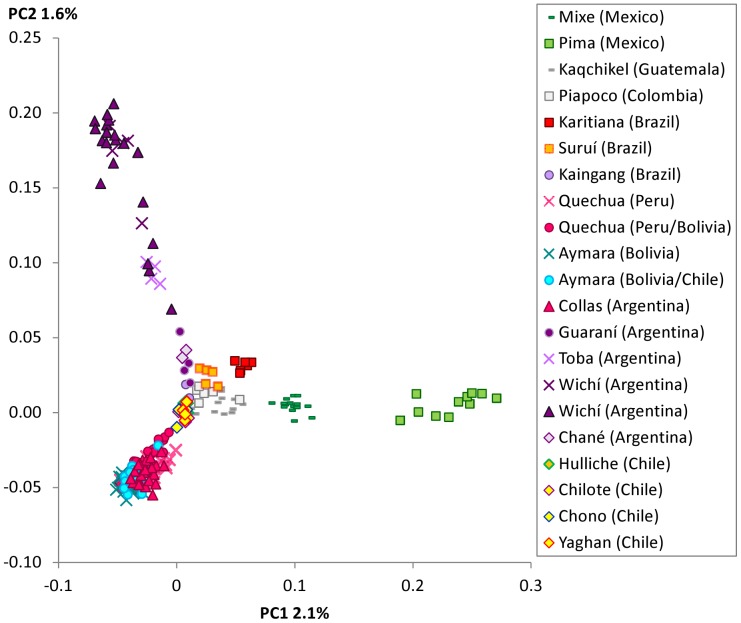
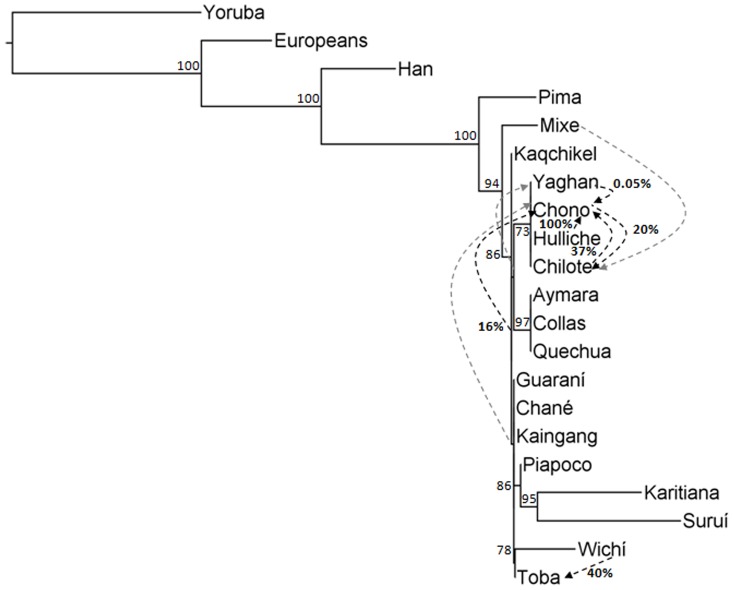
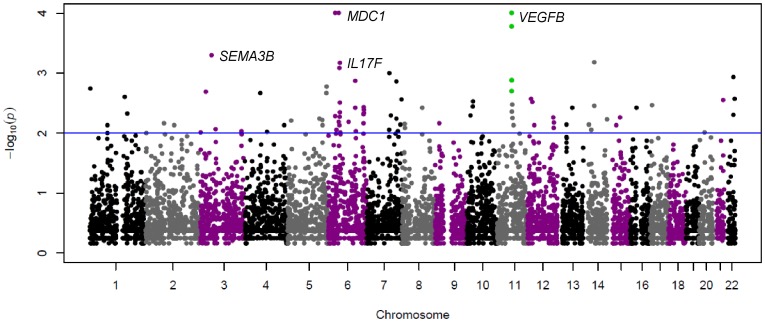
During their migrations out of Africa, humans successfully colonised and adapted to a wide range of habitats, including extreme high altitude environments, where reduced atmospheric oxygen (hypoxia) imposes a number of physiological challenges. This study evaluates genetic and phenotypic variation in the Colla population living in the Argentinean Andes above 3500 m and compares it to the nearby lowland Wichí group in an attempt to pinpoint evolutionary mechanisms underlying adaptation to high altitude hypoxia. We genotyped 730,525 SNPs in 25 individuals from each population. In genome-wide scans of extended haplotype homozygosity Collas showed the strongest signal around VEGFB, which plays an essential role in the ischemic heart, and ELTD1, another gene crucial for heart development and prevention of cardiac hypertrophy. Moreover, pathway enrichment analysis showed an overrepresentation of pathways associated with cardiac morphology. Taken together, these findings suggest that Colla highlanders may have evolved a toolkit of adaptative mechanisms resulting in cardiac reinforcement, most likely to counteract the adverse effects of the permanently increased haematocrit and associated shear forces that characterise the Andean response to hypoxia. Regulation of cerebral vascular flow also appears to be part of the adaptive response in Collas. These findings are not only relevant to understand the evolution of hypoxia protection in high altitude populations but may also suggest new avenues for medical research into conditions where hypoxia constitutes a detrimental factor.
Conflict of interest statement
Figures
Similar articles
-
Genetic adaptation of the hypoxia-inducible factor pathway to oxygen pressure among eurasian human populations.Mol Biol Evol. 2012 Nov;29(11):3359-70. doi: 10.1093/molbev/mss144. Epub 2012 May 23. Mol Biol Evol. 2012. PMID: 22628534
-
Genetic signatures reveal high-altitude adaptation in a set of ethiopian populations.Mol Biol Evol. 2013 Aug;30(8):1877-88. doi: 10.1093/molbev/mst089. Epub 2013 May 10. Mol Biol Evol. 2013. PMID: 23666210 Free PMC article.
-
Widespread signals of convergent adaptation to high altitude in Asia and america.Am J Hum Genet. 2014 Oct 2;95(4):394-407. doi: 10.1016/j.ajhg.2014.09.002. Epub 2014 Sep 25. Am J Hum Genet. 2014. PMID: 25262650 Free PMC article.
-
Human Genetic Adaptation to High Altitude: Evidence from the Andes.Genes (Basel). 2019 Feb 15;10(2):150. doi: 10.3390/genes10020150. Genes (Basel). 2019. PMID: 30781443 Free PMC article. Review.
-
Tibetan and Andean patterns of adaptation to high-altitude hypoxia.Hum Biol. 2000 Feb;72(1):201-28. Hum Biol. 2000. PMID: 10721618 Review.
Cited by
-
Genetic variants at the EGLN1 locus associated with high-altitude adaptation in Tibetans are absent or found at low frequency in highland Andeans.Ann Hum Genet. 2019 May;83(3):171-176. doi: 10.1111/ahg.12299. Epub 2019 Feb 4. Ann Hum Genet. 2019. PMID: 30719713 Free PMC article.
-
Cardiac responses to hypoxia and reoxygenation in Drosophila.Am J Physiol Regul Integr Comp Physiol. 2015 Dec 1;309(11):R1347-57. doi: 10.1152/ajpregu.00164.2015. Epub 2015 Sep 16. Am J Physiol Regul Integr Comp Physiol. 2015. PMID: 26377557 Free PMC article.
-
Selection scan reveals three new loci related to high altitude adaptation in Native Andeans.Sci Rep. 2018 Aug 24;8(1):12733. doi: 10.1038/s41598-018-31100-6. Sci Rep. 2018. PMID: 30143708 Free PMC article.
-
Increased hypoxic proliferative response and gene expression in erythroid progenitor cells of Andean highlanders with chronic mountain sickness.Am J Physiol Regul Integr Comp Physiol. 2020 Jan 1;318(1):R49-R56. doi: 10.1152/ajpregu.00250.2019. Epub 2019 Oct 16. Am J Physiol Regul Integr Comp Physiol. 2020. PMID: 31617751 Free PMC article.
-
Genomic and physiological mechanisms of high-altitude adaptation in Ethiopian highlanders: a comparative perspective.Front Genet. 2025 Jan 7;15:1510932. doi: 10.3389/fgene.2024.1510932. eCollection 2024. Front Genet. 2025. PMID: 39840284 Free PMC article. Review.
References
-
- West JB, Schoene RB, Milledge JS, Ward MP (2007) High altitude medicine and physiology. London: Hodder Arnold. xii, 484 p. p.
-
- Center for International Earth Science Information Network (CIESIN)/Columbia University (2012) National Aggregates of Geospatial Data: Population, Landscape and Climate Estimates Version 3 (PLACE III). Palisades, New York: NASA Socioeconomic Data and Applications Center.
-
- Beall CM (2006) Andean, Tibetan, and Ethiopian patterns of adaptation to high-altitude hypoxia. Annual Meeting of the Society for Integrative and Comparative Biology. San Diego, California: Integrative and Comparative Biology. pp. 18–24. - PubMed
-
- Aldenderfer M (2003) Moving Up in the World: Archaeologists seek to understand how and when people came to occupy the Andean and Tibetan plateaus. American Scientist 91: 542–549.
Publication types
MeSH terms
Substances
LinkOut - more resources
Full Text Sources
Other Literature Sources
Molecular Biology Databases
Miscellaneous
