. 2014 Apr 1:5:3550.
doi: 10.1038/ncomms4550.

Acidosis overrides oxygen deprivation to maintain mitochondrial function and cell survival

Affiliations
Free PMC article

Acidosis overrides oxygen deprivation to maintain mitochondrial function and cell survival

Mireille Khacho et al. Nat Commun. .
Free PMC article

Abstract

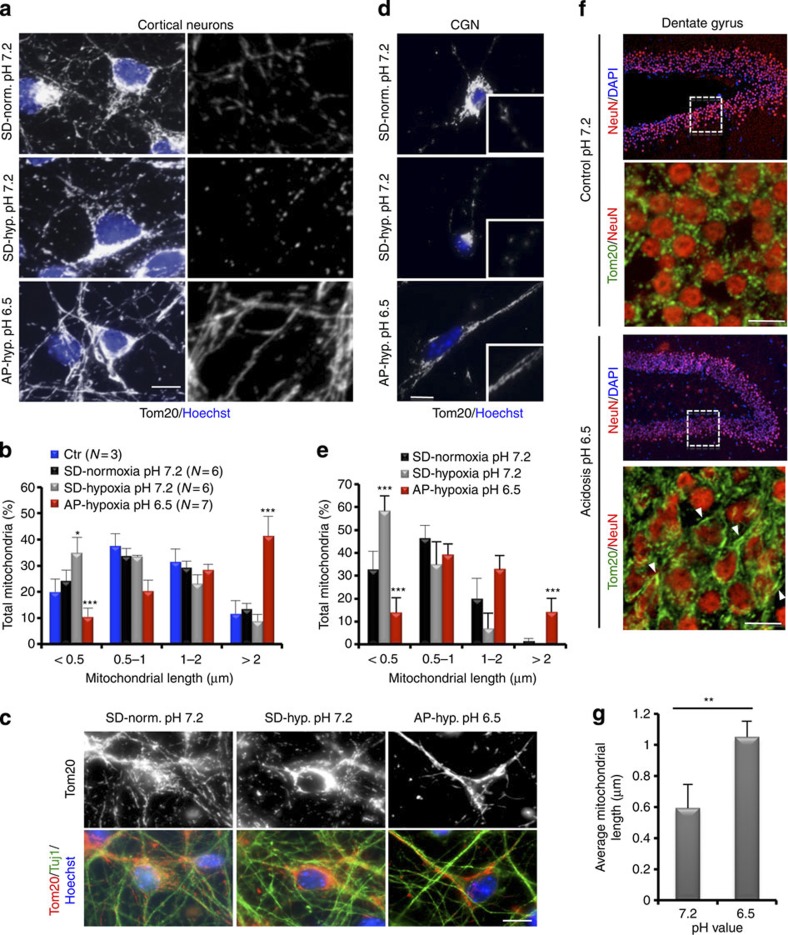
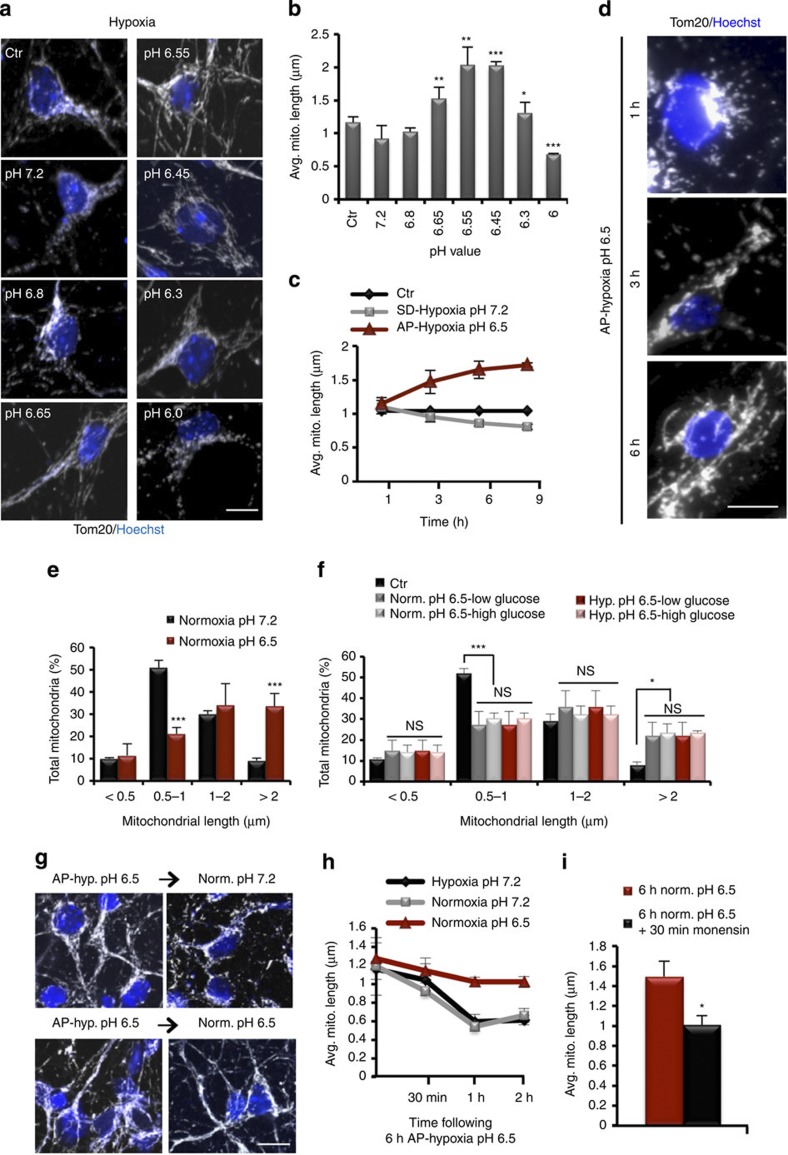
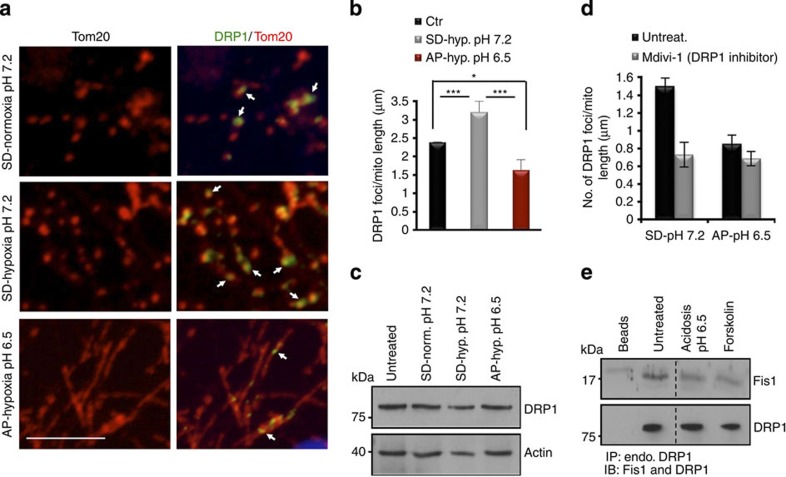
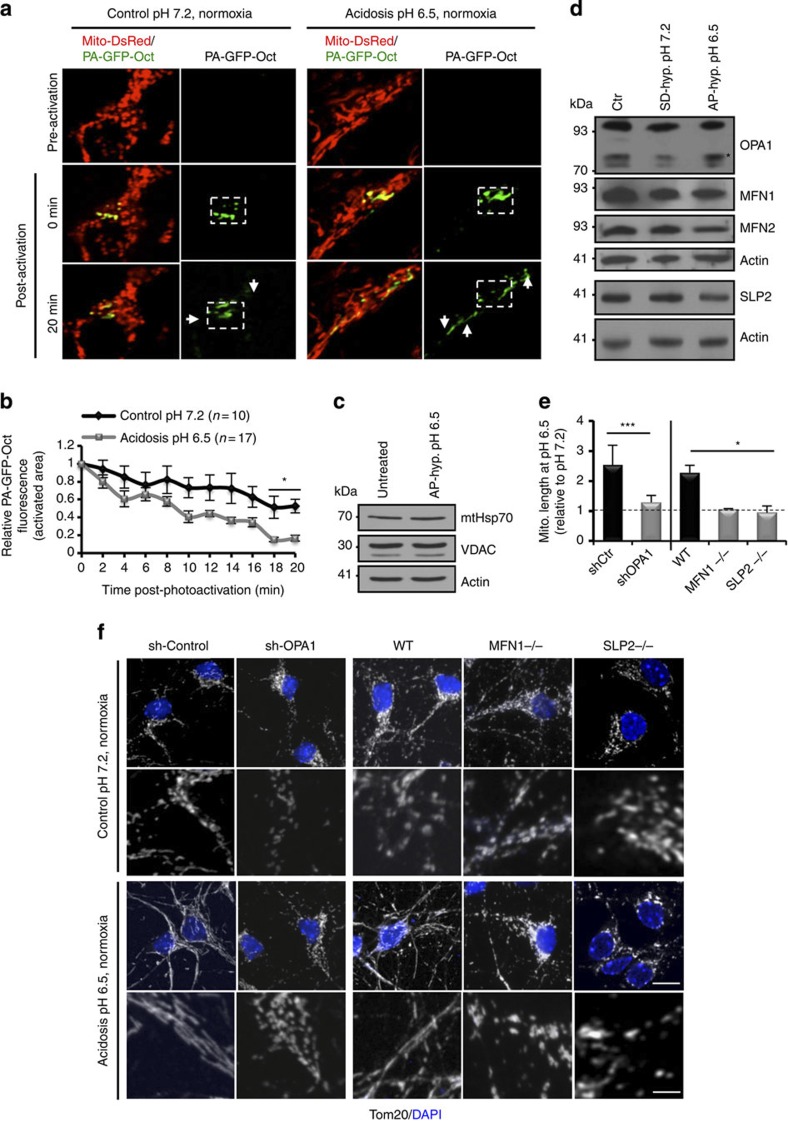
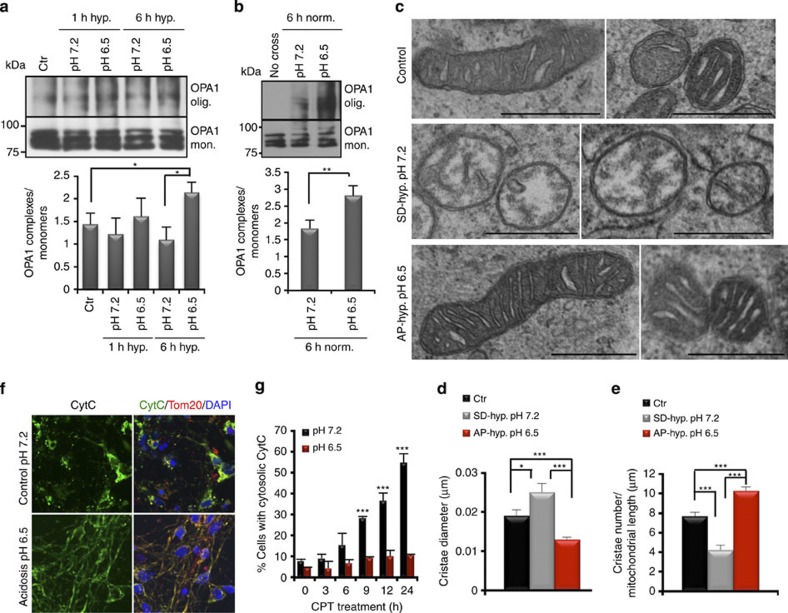
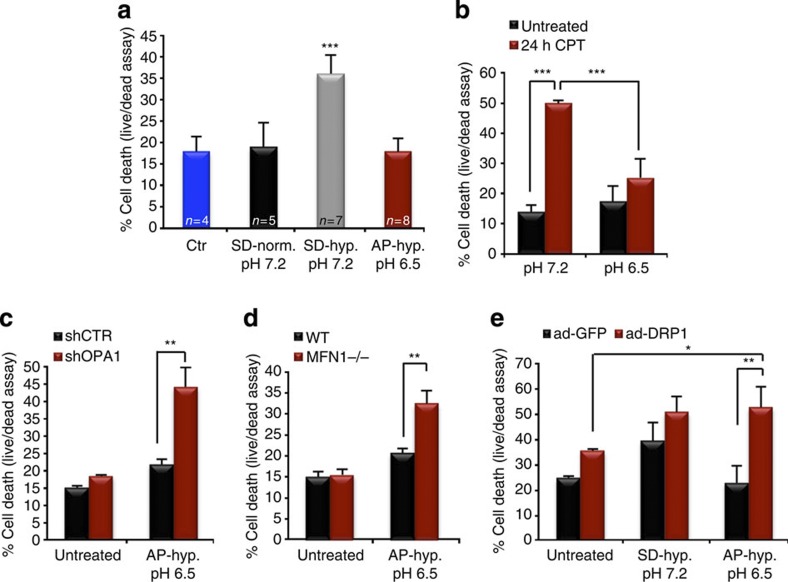
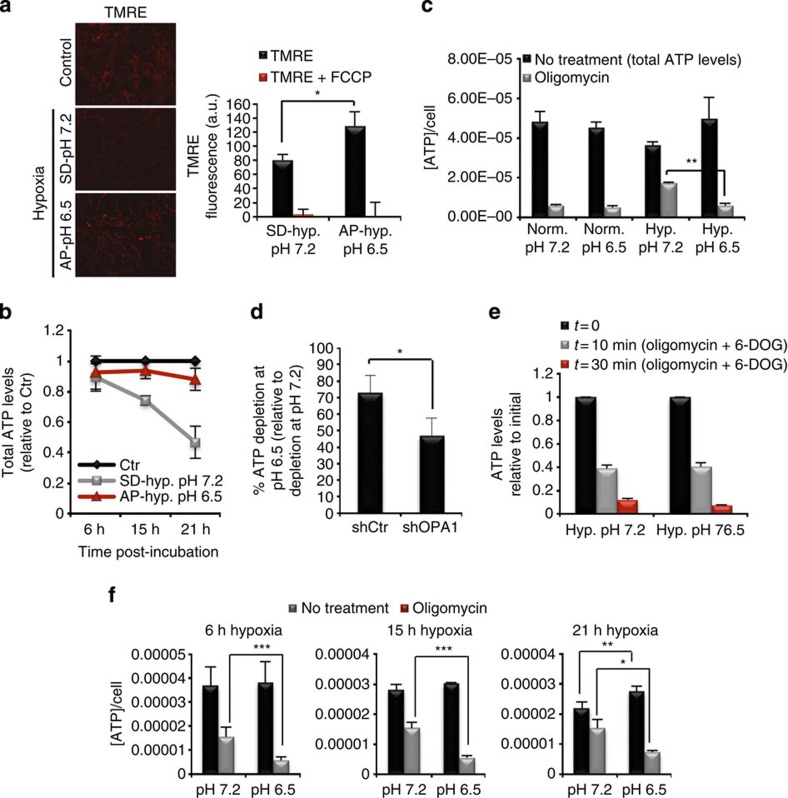
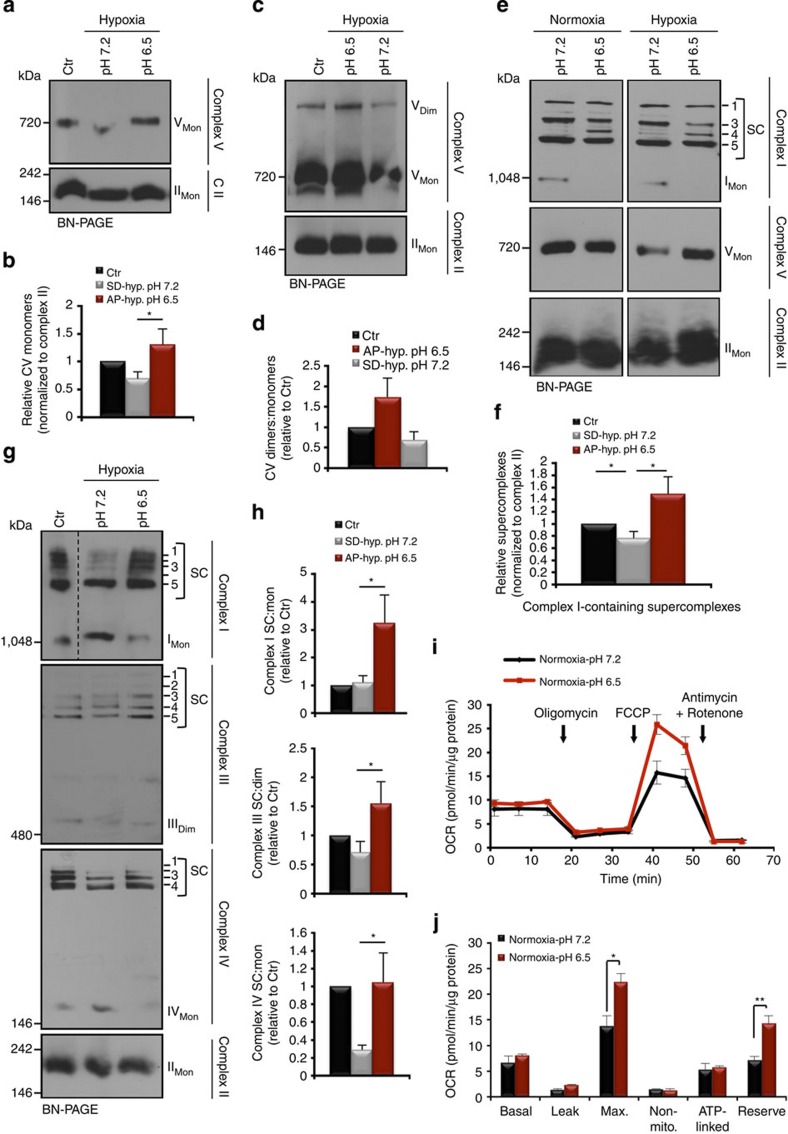
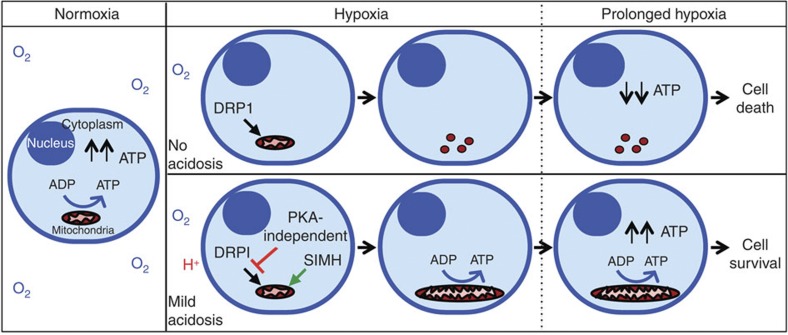
Sustained cellular function and viability of high-energy demanding post-mitotic cells rely on the continuous supply of ATP. The utilization of mitochondrial oxidative phosphorylation for efficient ATP generation is a function of oxygen levels. As such, oxygen deprivation, in physiological or pathological settings, has profound effects on cell metabolism and survival. Here we show that mild extracellular acidosis, a physiological consequence of anaerobic metabolism, can reprogramme the mitochondrial metabolic pathway to preserve efficient ATP production regardless of oxygen levels. Acidosis initiates a rapid and reversible homeostatic programme that restructures mitochondria, by regulating mitochondrial dynamics and cristae architecture, to reconfigure mitochondrial efficiency, maintain mitochondrial function and cell survival. Preventing mitochondrial remodelling results in mitochondrial dysfunction, fragmentation and cell death. Our findings challenge the notion that oxygen availability is a key limiting factor in oxidative metabolism and brings forth the concept that mitochondrial morphology can dictate the bioenergetic status of post-mitotic cells.


Figures

Figure 1
Figure 1. Extracellular acidification restructures mitochondria in post-mitotic cells.
(a) Representative confocal images of mitochondrial morphology in cultured cortical neurons following 18-h incubation at normoxic (Norm.) or hypoxic (Hyp.) conditions in SD or AP media. Mitochondria were visualized by Tom20 immunofluorescence. Panels on the right represent zoomed views of the mitochondria. (b) Mitochondrial length from (a) was quantified and binned into different length categories. Represented as mean and s.d. (n values indicated on graph). Ctr=control; represents neurons incubated in neurobasal media. (c) Representative images of mitochondrial morphology, revealed by Tom20 staining, in Tuj1+ cortical neurons at the indicated conditions. (d and e) Mitochondrial morphology in cultured CGN after 18-h incubation at the indicated conditions. Insets in (d) are zoomed views of mitochondria. (e) Mean and s.d. (n=3) of mitochondrial length data in (d). (f and g) Mitochondrial morphology in ex vivo hippocampal slice preparations incubated in normoxia for 4 h at the indicated conditions. Neurons were immunostained with NeuN (neuronal-specific nuclear protein) and Tom20 (mitochondria). Panels showing Tom20/NeuN staining are zoomed views of the boxed area within the hippocampus. Arrowheads indicate elongated mitochondria. (g) Average mitochondrial length and s.d. were plotted for the indicated conditions. *P<0.05; **P<0.01; ***P<0.001 (Student’s t-test). For all images scale=10 μm.
Figure 2
Figure 2. Acidosis-mediated mitochondrial elongation is pH-specific, rapid, reversible and O2- and glucose-independent.
(a) Representative confocal images of mitochondrial morphology in cultured cortical neurons following incubation at fixed pH values in hypoxia. Ctr=control; represents neurons incubated in neurobasal media. (b) Average mitochondrial length and s.d. (n=3) were plotted for the indicated pH values. (c) Average mitochondrial length and s.d. (n=3) over time at indicated conditions. (d) Immunofluorescence of Tom20 (mitochondria) showing the change in mitochondrial length in cortical neurons by physiological acidosis at the indicated times. (e) Mean and s.d. (n=3) of mitochondrial length distribution during normoxic conditions at indicated pH values for 6 h. (f) Mean and s.d. (n=3) of mitochondrial length distribution during normoxic or hypoxic conditions in the presence of low (5.5 mM) or high (25 mM) glucose levels for 6 h. (g and h) Analysis of mitochondrial morphology after 6-h incubation in AP-Hypoxia pH 6.5 and following reoxygenation at the indicated pH values. (h) Graph of the change in average mitochondrial length (s.d., n=3) at the indicated conditions following a 6-h incubation in AP-Hypoxia pH 6.5. (i) Average mitochondrial length and s.d. (n=3) were plotted for the indicated conditions. ns=not significant, *P<0.05; **P<0.01; ***P<0.001 (Student’s t-test). For all images scale=10 μm.
Figure 3
Figure 3. Mild acidosis inhibits DRP1-mediated mitochondrial fission.
(a) Colocalization of DRP1 foci at mitochondria by immunofluorescence of DRP1 and Tom20 in cortical neurons using confocal imaging. Arrows show DRP1 foci localized at mitochondria. Scale=5 μm. (b) Quantification of the number of DRP1 foci colocalized to mitochondria and represented as mean and s.d. (n=3). (c) Western blot of the indicated proteins from whole cell lysates of cultured cortical neurons following 6-h incubation at the indicated conditions. (d) Quantification of the number of DRP1 foci colocalized to mitochondria following 6-h hypoxic incubation in SD or AP media in the presence or absence of the fission inhibitor Mdivi-1. (e) Western blot of indicated proteins following incubation for 3 h at the indicated conditions and immunoprecipitation of endogenous (endo.) DRP1 using anti-DRP1 antibody.
Figure 4
Figure 4. Mild acidosis regulates mitochondrial dynamics.
(a) Representative images of mitochondrial fusion over time (indicated in minutes) following activation of exogenously expressed PA-GFP-Oct. Boxes indicate photo-activated regions and arrows indicate spread of the GFP signal within mitochondria (revealed by exogenous expression of Mito-DsRed). (b) Quantification of mitochondrial fusion in cortical neurons as a loss of GFP fluorescence in the activated region. Data represent the mean and s.d. of n=10 (control) and n=17 (experimental) from three independent experiments. (c and d) Western blot of the indicated proteins from whole-cell lysates of cortical neurons incubated for 6 h at the indicated conditions. Asterisk indicates s-OPA1. (e) Mean and s.d. (n=3) of mitochondrial length during acidosis, of the indicated genotypes, relative to control conditions. (f) Representative images of mitochondrial morphology from cortical neurons of the indicated genotypes following 6-h incubation in MES-buffered media at the indicated conditions. Bottom panel of each condition is a zoom view of mitochondria. Scale=10 μm. *P<0.05; ***P<0.001 (Student’s t-test).
Figure 5
Figure 5. Mild acidosis regulates cristae architecture.
(a,b) Western blot of OPA1 oligomers and monomers from lysates of BMH crosslinking in live cortical neurons at the indicated conditions. OPA1 western blot has been spliced to better clarify where monomeric and oligomerized Opa1 appear. Graphs represent the mean and s.d. (n=3) quantification of OPA1 oligomer:monomer ratio. (ce) Representative EM images of mitochondrial ultrastructure following 6-h incubation at the indicated conditions. Scale=500 nm. Graphs in (d,e) represent mean and s.e.m (n=10) for quantification of cristae diameter and cristae number. Ctr=control represents neurons incubated in neurobasal media. (f,g) Representative images and quantification (mean and s.d., n=4) of CytC localization following CPT treatment in MES-buffered media at pH 7.2 or 6.5 in normoxia. *P<0.05; **P<0.01; ***P<0.001 (Student’s t-test).
Figure 6
Figure 6. Acidosis-mediated mitochondrial remodelling protects neurons from cell death during hypoxic stress.
(a) Quantification of cell death of cortical neurons as mean and s.d. (n values indicate independent experiments) following 30-h incubation in SD or AP media at the indicated conditions. (b) Mean and s.d. (n=3) of neuronal cell death analysis following 24-h treatment with CPT in MES-buffered media at pH 7.2 or 6.5 in normoxia. (c) Quantification of cell death in neurons infected with lentivirus encoding a scrambled (shCTR) or OPA1-specific (shOPA1) shRNA following 30 h in SD or AP media at the indicated conditions (mean and s.d., n=3). (d) Mean and s.d. (n=4) of cell death quantification in WT (wild-type) or MFN1-deficient (MFN1−/−) cortical neurons following 30-h incubation in SD or AP media at the indicated conditions. (e) Quantification of cell death in neurons infected with adenovirus-encoding GFP or DRP1-YFP following 30-h incubation in SD or AP media at the indicated conditions (mean and s.d., n=3). *P<0.05; **P<0.01; ***P<0.001 (Student’s t-test).
Figure 7
Figure 7. Acidosis maintains mitochondrial function during hypoxic stress.
(a) TMRE staining and quantification of fluorescence intensity following 18-h incubation in SD or AP media in hypoxia. Mean and s.d. (n=3 from three independent experiments). The uncoupler FCCP, which dissipates the membrane potential, is used to show specificity of the measured TMRE fluorescence. (b) Total ATP levels relative to normoxic control (in black). Mean and s.d. (n=5). (c) Total ATP concentration per cell at steady state (black) and after 1-h oligomycin treatment (grey) following 6 h of treatment at the indicated conditions. Mean and s.d. (n=3 replicates from six independent experiments). (d) Quantification of the amount of ATP depletion following 1-h oligomycin treatment in cortical neurons infected with lentivirus encoding a scrambled control (shCtr) or OPA1-specific shRNA (shOPA1). Mean and s.d. (n=3 replicates from three independent experiments). (e) ATP levels per cell relative to initial values (black) following oligomycin and 6-DOG treatment. Mean and s.d. (n=3 replicates from three independent experiments). (f) Total ATP levels per cell at steady state (black) and after 1-h oligomycin treatment (grey). Graphs represent mean and s.d. of n=3 replicates from six independent experiments. *P<0.05; **P<0.01; ***P<0.001 (Student’s t-test).
Figure 8
Figure 8. Acidosis instigates an adaptive reprogramming of mitochondrial respiratory efficiency.
(ad) Representative BN-PAGE of Complex V (ATP synthase) (a) monomers (whole cells) and (c) dimers (isolated mitochondria) in cortical neurons following 6-h treatment in the indicated conditions. In (c), longer exposure of the membrane was required to visualize the dimeric Complex V. Graphs represent mean and s.e.m of (b) n=5 and (d) n=3 independent experiments. Mon=monomers, Dim=dimers, and CV=Complex V. (e) Representative BN-PAGE of the indicated respiratory complexes using anti-NDUFA9 (Complex-I), anti-ATP5a (Complex-V) and anti-Core2 (Complex-II). Cortical neurons were treated for 6 h in the indicated conditions. SC 1–5=supercomplex assembly. (f) Quantification of relative assembly of supercomplexes visualized using anti-NDUFA9 (Complex-I). Mean and s.e.m of n=4 independent experiments. (g,h) Representative BN-PAGE of the indicated respiratory complexes using anti-NDUFA9 (Complex-I), anti-UQCRC2 (Complex-III), anti-Complex IV subunit 1 (Complex-IV) and anti-Core2 (Complex-II) following 6 h in the indicated conditions. Graphs in (h) are mean and s.e.m of n=6 (Complex-I), n=4 (Complex-III) and n=3 (Complex-IV) independent experiments. (i,j) OCR in cortical neurons using a Seahorse XF24 Extracellular Flux Analyzer. Mean and s.d. (n=4 replicates from three independent experiments). *P<0.05; **P<0.01; ***P<0.001 (Student’s t-test).
Figure 9
Figure 9. Mitochondrial restructuring by mild acidosis determines cellular bioenergetics during hypoxia.
The cartoon depicts the cascade of events following a decrease in oxygen levels and the role of mild acidosis in triggering mitochondrial restructuring and reprogramming to determine cellular bioenergetics and cell fate. Upper row: hypoxia causes mitochondrial fragmentation, loss of efficient ATP production and eventual cell death. Lower row: mild acidosis during hypoxia prevents DRP1-mediated fission and promotes mitochondrial elongation (in a SIMH-dependent manner) and cristae remodelling to maintain ATP levels and cell survival. In our model and experiments, ‘no acidosis’ and ‘mild acidosis’ indicate an extracellular pH of 7.2 and 6.5, respectively; ‘hypoxia’ indicates incubation at 1% oxygen for 0–12 h, and ‘prolonged hypoxia’ is considered following 12–21 h of incubation at 1% oxygen.

References

    1. Lin M. T. & Beal M. F. Mitochondrial dysfunction and oxidative stress in neurodegenerative diseases. Nature 443, 787–795 (2006). - PubMed
    1. Terman A., Kurz T., Navratil M., Arriaga E. A. & Brunk U. T. Mitochondrial turnover and aging of long-lived postmitotic cells: the mitochondrial-lysosomal axis theory of aging. Antioxid. Redox. Signal 12, 503–535. - PMC - PubMed
    1. Newmeyer D. D. & Ferguson-Miller S. Mitochondria: releasing power for life and unleashing the machineries of death. Cell 112, 481–490 (2003). - PubMed
    1. Detmer S. A. & Chan D. C. Functions and dysfunctions of mitochondrial dynamics. Nat. Rev. Mol. Cell Biol. 8, 870–879 (2007). - PubMed
    1. Youle R. J. & van der Bliek A. M. Mitochondrial fission, fusion, and stress. Science 337, 1062–1065 (2012). - PMC - PubMed

Publication types