Review
. 2014 Jul;10(7):403-12.
doi: 10.1038/nrrheum.2014.36. Epub 2014 Apr 1.

Selection bias in rheumatic disease research

Affiliations
Review

Selection bias in rheumatic disease research

Hyon K Choi et al. Nat Rev Rheumatol. 2014 Jul.

Abstract

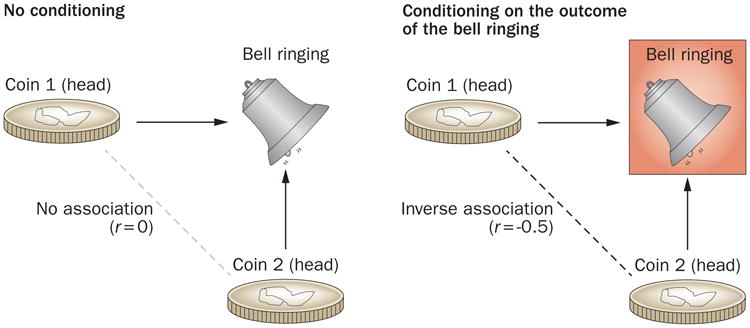
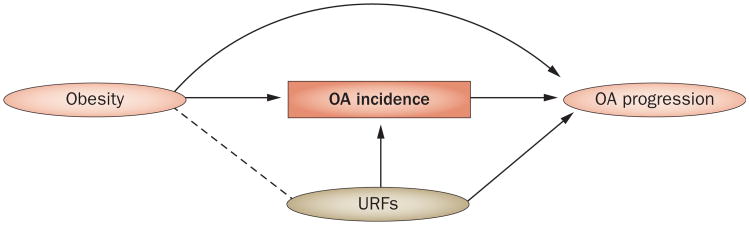
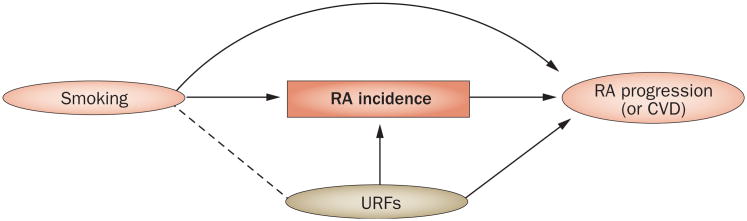
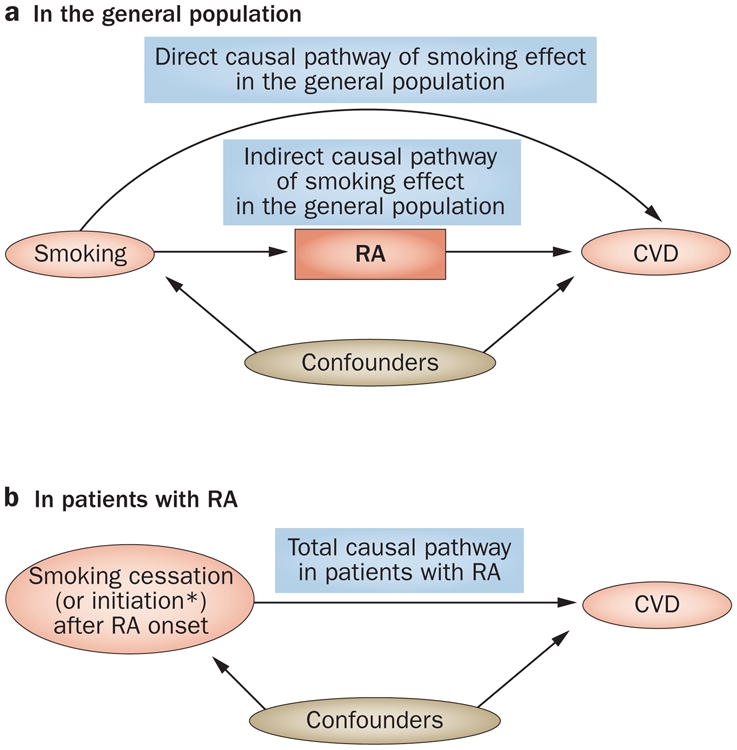
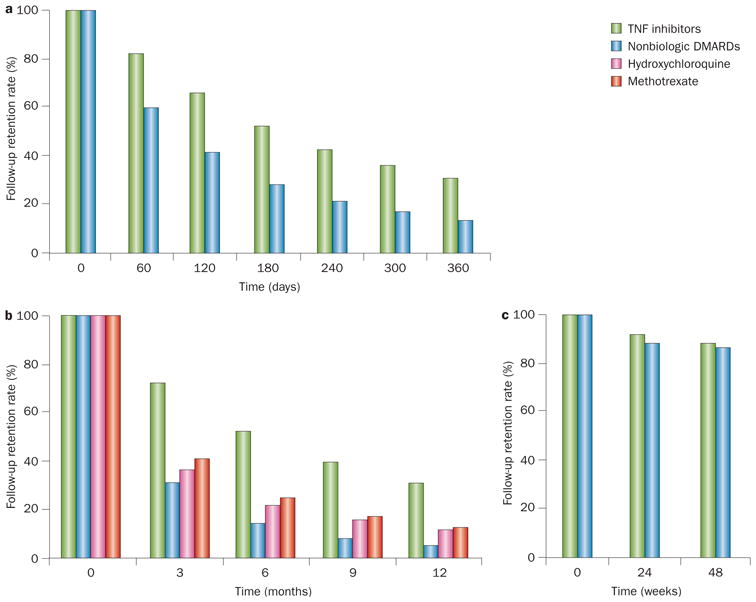
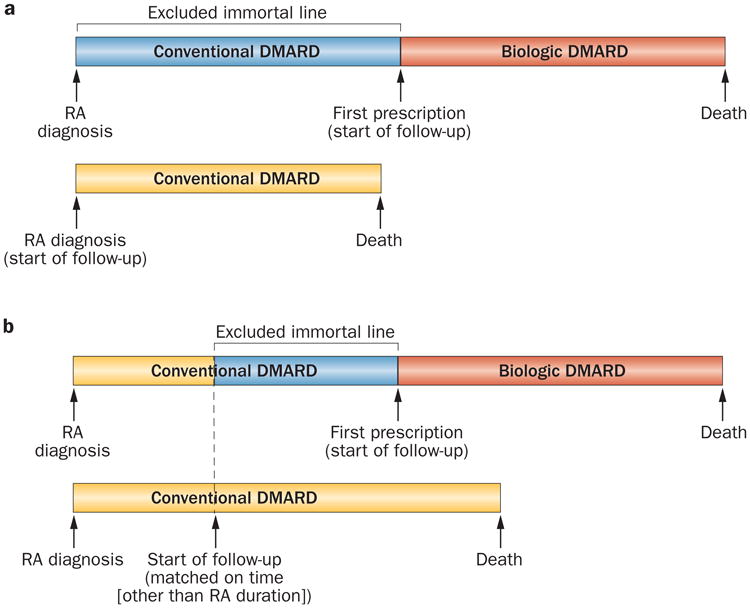
The identification of modifiable risk factors for the development of rheumatic conditions and their sequelae is crucial for reducing the substantial worldwide burden of these diseases. However, the validity of such research can be threatened by sources of bias, including confounding, measurement and selection biases. In this Review, we discuss potentially major issues of selection bias--a type of bias frequently overshadowed by other bias and feasibility issues, despite being equally or more problematic--in key areas of rheumatic disease research. We present index event bias (a type of selection bias) as one of the potentially unifying reasons behind some unexpected findings, such as the 'risk factor paradox'--a phenomenon exemplified by the discrepant effects of certain risk factors on the development versus the progression of osteoarthritis (OA) or rheumatoid arthritis (RA). We also discuss potential selection biases owing to differential loss to follow-up in RA and OA research, as well as those due to the depletion of susceptibles (prevalent user bias) and immortal time bias. The lesson remains that selection bias can be ubiquitous and, therefore, has the potential to lead the field astray. Thus, we conclude with suggestions to help investigators avoid such issues and limit the impact on future rheumatology research.


Conflict of interest statement

Competing interests: The authors declare no competing interests.

Figures

Figure 1
Figure 1
A causal diagram illustration of index event bias, also known as collider stratification bias. A causal diagram consists of a set of relevant variables (for example, exposures, potential confounders, and outcomes) and arrows to indicate the flow of causation between those variables. When there are multiple independent causes for an effect (i.e. a common effect), conditioning on this common effect (i.e. selecting only scenarios in which the effect is observed) leads to a spurious association between those causes. A classic, simple example of a coin toss (cause) and a ringing bell (effect) can illustrate the logic behind this phenomenon. In this experiment involving two coins and a bell, the bell rings whenever either coin comes up heads on a toss of both coins. Thus, the bell ringing is a common effect of heads appearing on the toss of either coin. In causal diagrams, this is depicted as colliding causal arrows on a given common effect variable (which gives the name ‘collider’). Obviously, heads appearing from one coin toss is independent of heads appearing from the other coin toss; thus, these two causes are mutually independent with a correlation coefficient between the two of 0. However, if we calculate the correlation from only the events when the bell rings (i.e. we condition on the common effect of the bell ringing), the appearances of heads on the two coins are no longer independent, resulting in a correlation coefficient of −0.5. This discrepancy occurs because if coin A came up tails, then that must mean that coin B came up heads (and vice versa), as we know that the bell rang. This simple experiment demonstrates that conditioning on a common effect induces a negative correlation between two causes or ‘risk factors’. Conditioning is marked by a box around the variable name, and the spurious association is marked by a dotted line between variables, as per causal diagram convention.
Figure 2
Figure 2
A causal diagram of a typical observational study showing the assessment of the effect of obesity on OA progression among patients with (incident) OA. Conditioning on (or restricting to) those with OA incidence (i.e. conditioning on a common effect, as explained in Figure 1) results in obesity and the URFs becoming negatively associated, as indicated by a dotted line between obesity and URFs, even though these two factors were not associated before OA incidence. This artificially-generated negative confounding results in a biased association between obesity and OA progression (represented as obesity—URF→OA progression), leading to effect estimation biased towards the null (see Figure 1 legend for details). Abbreviations: OA, osteoarthritis; URFs, unknown or unmeasured risk factors.
Figure 3
Figure 3
A causal diagram of a typical observational study showing the assessment of the effect of smoking on RA progression (or CVD complications) among patients with RA. Similarly to in Figures 1 and 2, we consider independent risk factors (specifically, smoking and URFs) that are associated with both RA and RA progression (or CVD). Note that URFs are not associated with smoking (as indicated by the absence of a line between the two factors) before individuals develop RA. Thus, URFs would not be a confounder in a study of smoking and RA progression (or CVD) in the general population. However, smoking and URFs are no longer independent (as indicated by a dotted line between them) following conditioning on a common effect (in this case, restriction of the study sample to patients with RA, as denoted by a box around RA). Consequently, a biased association occurs between smoking and RA progression (or CVD) (represented as smoking—URFs → RA progression [or CVD]). As the study design leads this spurious association with URFs to operate as a negative confounder, the resulting effect measure becomes underestimated or reversed (that is, paradoxical) unless the study appropriately adjusts for URFs. Abbreviations: CvD, cardiovascular disease; RA, rheumatoid arthritis; URFs, unknown or unmeasured risk factors.
Figure 4
Figure 4
Causal diagrams displaying the effect of smoking on CVD a | A causal diagram displaying two causal pathways (direct and indirect) for the total effect of smoking on CVD complications in the general (unselected) population. The box around ‘confounders’ denotes adjustments. The total effect of smoking on the risk of CvD in this population is the net combined causal effect through both pathways. b | A causal diagram of the total causal effect of smoking on CVD complications among patients with RA (i.e. a restricted population). *Theoretically, smoking initiation after RA onset would be equivalent to smoking exposure in the general population in part a; however, in practice, this would be unusual after RA onset. Alternatively, the impact of smoking cessation can be evaluated in these studies. Abbreviations: CVD, cardiovascular disease; RA, rheumatoid arthritis.
Figure 5
Figure 5
Differential loss to follow-up in studies of RA therapy. a,b | Two observational pharmaco-epidemiological studies, showed high and differential loss rates between groups. c | By contrast, much lower levels of loss to follow-up were observed in a randomized trial of a biologic agent in RA at similar time points. Despite effectively controlling for confounders in the observational studies,, such a high level of differential loss to follow-up threatens the embedded assumption that loss to follow-up is completely random (i.e. not associated with an outcome, or mediators of an outcome), leaving the study design open to potential selection bias. Abbreviation: RA, rheumatoid arthritis.
Figure 6
Figure 6
Immortal time bias as a form of selection bias. Immortal time bias is introduced as a form of selection bias in cohort studies when a period of ‘immortal time’ is excluded from the analysis. This exclusion occurs because the start of follow-up for the group receiving treatment (a biologic DMARD in this example) is defined by the start of treatment and is, by design (or by practice pattern), later than that for the comparison group (receiving a conventional DMARD). a | A depiction of the comparison group's follow-up starting at the time of RA diagnosis. b | A depiction of the comparison group's follow-up starting sometime after RA diagnosis (matched on certain time factors other than RA duration), but before biologic DMARD use. In both cases, unless the excluded period of nonbiologic agent use before biologic agent use (i.e. the unexposed immortal time) is appropriately assigned to the nonbiologic group in a time-varying manner, the immortal time-induced selection bias could lead to a major survival advantage for biologic agent users. Abbreviation: RA, rheumatoid arthritis.

References

    1. Reginster JY. The prevalence and burden of arthritis. Rheumatology (Oxford) 2002;41(Suppl. 1):3–6. - PubMed
    1. Symmons DP, Gabriel SE. Epidemiology of CVD in rheumatic disease, with a focus on RA and SLE. Nat Rev Rheumatol. 2011;7:399–408. - PubMed
    1. Gabriel SE. Heart disease and rheumatoid arthritis: understanding the risks. Ann Rheum Dis. 2010;69(Suppl. 1):i61–i64. - PMC - PubMed
    1. Eder L, et al. The association between smoking and the development of psoriatic arthritis among psoriasis patients. Ann Rheum Dis. 2012;71:219–224. - PubMed
    1. Zhang Y, et al. Methodologic challenges in studying risk factors for progression of knee osteoarthritis. Arthritis Care Res (Hoboken) 2010;62:1527–1532. - PMC - PubMed

Publication types