. 2014 Apr 1:5:3569.
doi: 10.1038/ncomms4569.

Morphological and functional remodelling of the neuromuscular junction by skeletal muscle PGC-1α

Affiliations

Morphological and functional remodelling of the neuromuscular junction by skeletal muscle PGC-1α

Anne-Sophie Arnold et al. Nat Commun. .

Abstract

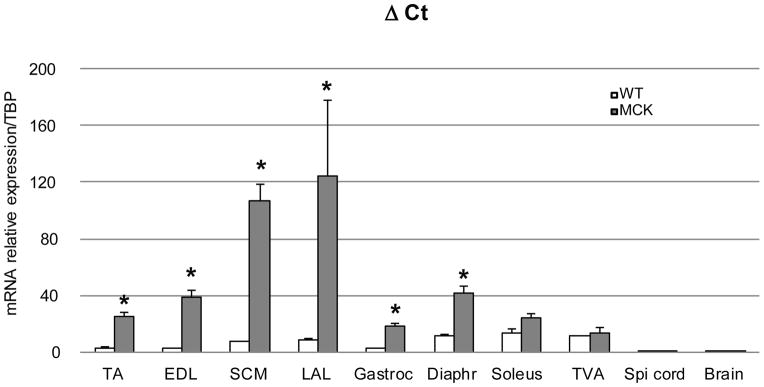
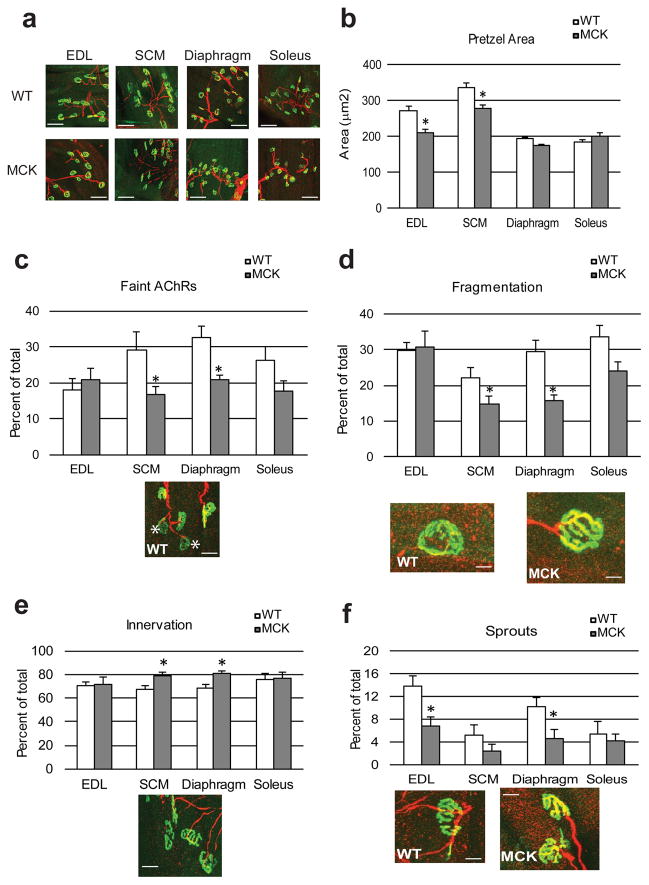
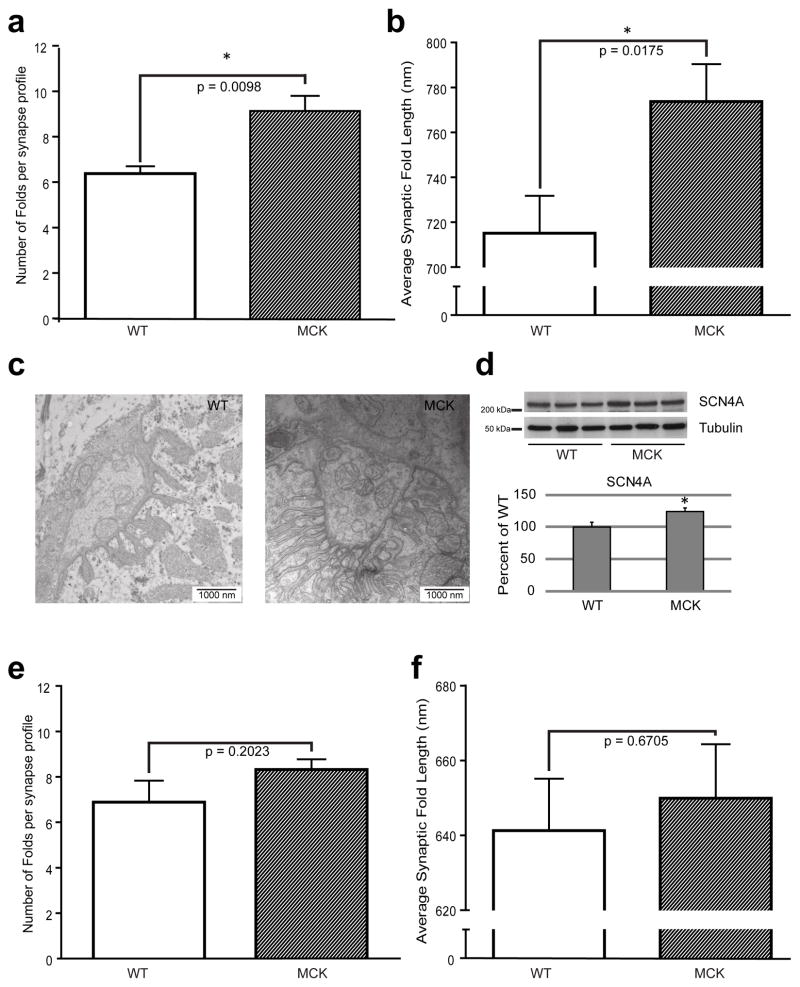
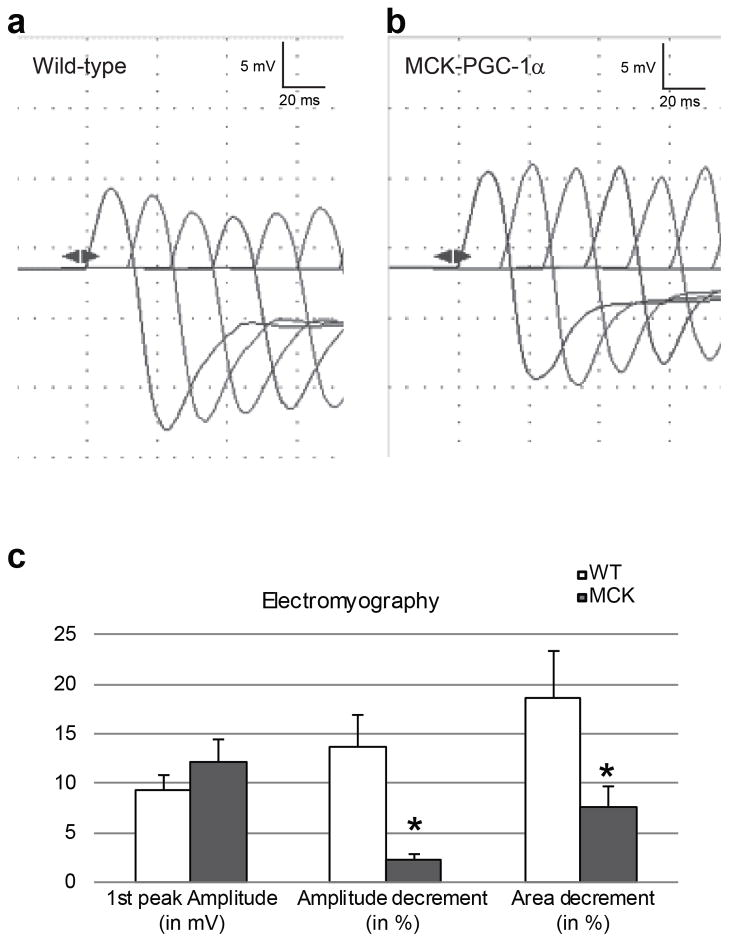
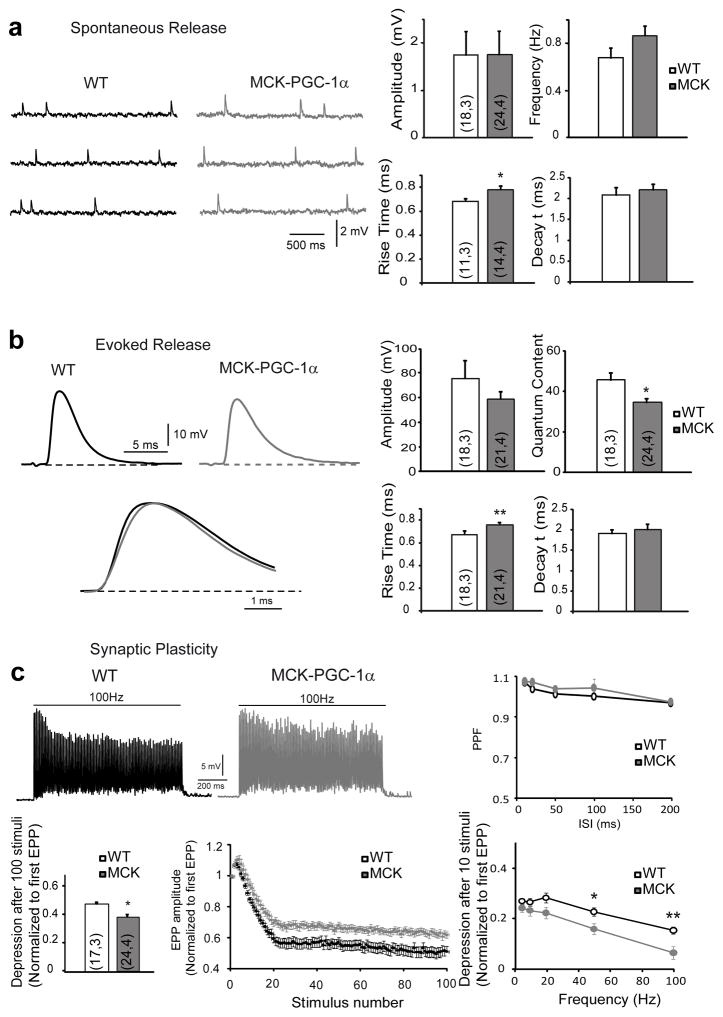
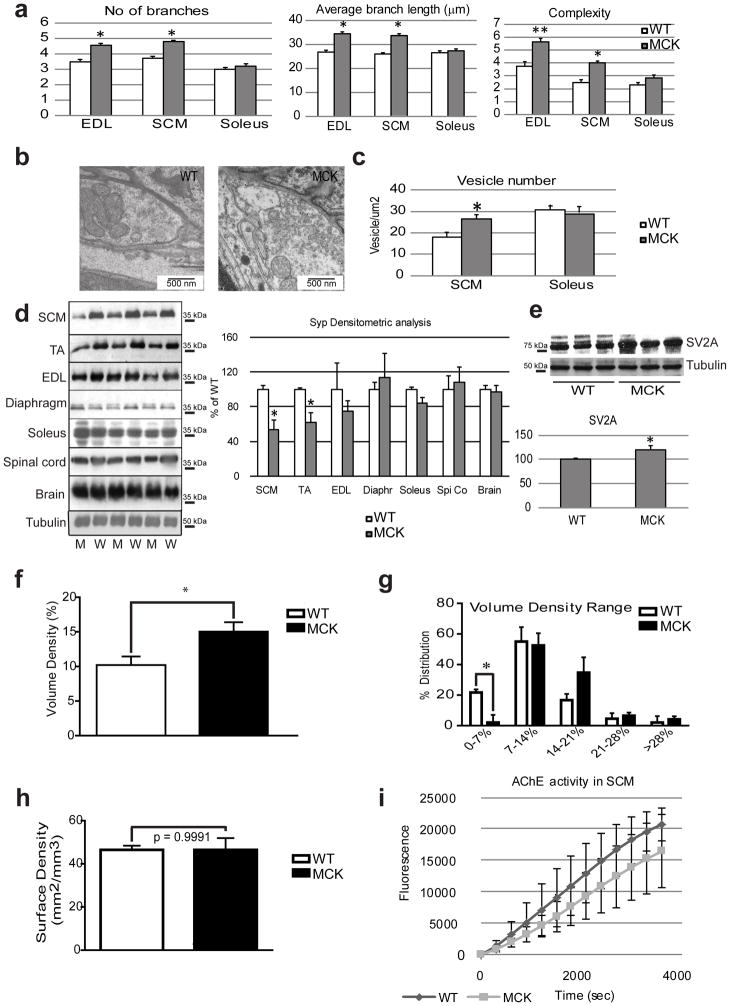
The neuromuscular junction (NMJ) exhibits high morphological and functional plasticity. In the mature muscle, the relative levels of physical activity are the major determinants of NMJ function. Classically, motor neuron-mediated activation patterns of skeletal muscle have been thought of as the major drivers of NMJ plasticity and the ensuing fibre-type determination in muscle. Here we use muscle-specific transgenic animals for the peroxisome proliferator-activated receptor γ co-activator 1α (PGC-1α) as a genetic model for trained mice to elucidate the contribution of skeletal muscle to activity-induced adaptation of the NMJ. We find that muscle-specific expression of PGC-1α promotes a remodelling of the NMJ, even in the absence of increased physical activity. Importantly, these plastic changes are not restricted to post-synaptic structures, but extended to modulation of presynaptic cell morphology and function. Therefore, our data indicate that skeletal muscle significantly contributes to the adaptation of the NMJ subsequent to physical activity.


Conflict of interest statement

None of the authors has competing financial interests.

Figures

Figure 1
Figure 1. Level of expression of PGC-1α in different muscles from WT and MCK mice
Relative PGC-1α mRNA levels in tissues from WT (white bars, n=3) and MCK- PGC-1α mice (grey bars, n=3) (6- to 8-weeks old). Total RNA was reverse transcribed and the level of expression of PGC-1α was determined by real-time PCR, relative to the TATA-Binding Protein (TBP) expression level, analyzed according to the ΔCt method. Each bar represents mean ± SEM. * p<0.05 (n=3, t test two tails) TA: tibialis anterior, EDL: extensor digitorum longus, SCM: sternocleidomastoidian, LAL: levator auris longus, Gastroc: gastrocnemius, Diaphr: diaphragm, TVA: transversus abdominis.
Figure 2
Figure 2. Structural comparison of the NMJ from WT and transgenic mice
(a) Representative confocal stack image of fluorescently labeled NMJ in different muscles. Muscles were stained with AF488-coupled α-bungarotoxin to visualize AChRs (green) and anti-neurofilament antibodies coupled to cyanin 5 to stain the nerve part (red). Calibration bar: 200 μm (b) Mean area of the AChRs aggregates was determined by Image J in arbitrary units. Each bar represents mean ± SEM. * p<0.05 (N=3, t test two tails) (c–f) The frequency of faint AChRs clusters, highlighted by a white star Calibration bar: 50 μm (c), fragmented AChRs clusters Calibration bar: 1.5 μm (d), innervated pretzels Calibration bar: 40 μm (e) and sprouted AChRs clusters Calibration bar: 25 μm (f) was determined on confocal images stack. Each bar represents mean ± SEM from at least 100 NMJ from 3 mice * p<0.05 (N=3, n>100, t test two tails). White bars represent wt animals, grey bars transgenic mice.
Figure 3
Figure 3. Synaptic folds characterization on the TEM images from WT and transgenic mice NMJs
(a) The average number of folds attached to synapses was determined for WT and MCK mice in SCM muscle. (b) Synaptic fold lengths from SCM muscles were scaled and measured with Image J and averaged. Each bar represents mean ± SEM. (n=4, t test two tails). (c) Representative TEM image of the NMJ area of SCM muscle from WT or MCK animals. (d) Western Blot detection of the Nav1.4 expression in SCM muscles from WT and MCK animals. The relative band intensity was analyzed by Image J. The WT/tubulin ratio was set as 100 %. (e) The average number of folds attached to synapses was determined for WT and MCK mice in soleus muscle. (f) Synaptic fold lengths from soleus muscles were scaled and measured with Image J and averaged. Each bar represents mean ± SEM. (n=4, t test two tails). SF: Synaptic folds, m: mitochondria.
Figure 4
Figure 4. Electromyographic properties of the gastrocnemius muscles in WT and MCK mice after repetitive nerve stimulation of the sciatic nerve
(a, b) Representative electromyography traces of WT (a) and MCK mice (B). (c) Average of the 1st peak amplitude in mV and the decrement (amplitude and area) calculated between the 1st and the 4th peak of the train of action potentials recorded in WT (white bars) and MCK animals (grey bars). Each bar represents mean ± SEM * p<0.05 (n=7, t test two tails).
Figure 5
Figure 5. Electrophysiological properties of LAL muscles from WT or transgenic mice
(a) The spontaneous neurotransmitter release of LAL muscle resembled the representative traces of mEPP in WT (black) and MCK- PGC-1α (gray) NMJs. Amplitude, frequency of mEPP and their rise and decay times were determined. (b) Evoked neurotransmitter release resembled the representative traces of EPP in WT (black) and MCK- PGC-1α (gray) NMJs. Amplitude, quantum content of EPP and their rise and decay times were determined. (c) The synaptic plasticity shows a representative trace of steady-state depression in WT (black) and MCK-PGC-1α (gray) mice. The pair-pulse-facilitation (PPF) at inter-stimulus-intervals(ISI) ranging from 10 to 200 ms and the steady-state depression were measured at the end of the train and normalized to the amplitude of the first EPP. The normalized depression after 10 repetitive stimuli was measured between 0 and 100 Hz. The results are represented as mean ± SEM. The numbers in the bars are n,N: number of fibers, number of mice.
Figure 6
Figure 6. Pre-synaptic remodeling of the NMJ by PGC-1α
(a) The number of branches per AChRs cluster and the average length of the branches were determined on confocal images stack using Image J in arbitrary units on WT (white bars) and MCK (grey bars) mice. The complexity is defined as the branch number x the total branch length divided by 100. Each bar represents mean ± SEM from at least 100 NMJ from 3 mice * p<0.05 ** p<0.01 (N=3, n>100, t test two tails). (b) Representative TEM picture illustrating the synaptic vesicle number in the SCM muscle from WT and MCK mice. (c) Quantification of synaptic vesicle number per μm2 determined by Image J on WT (white bars) and MCK (grey bars) mice. Each bar represents mean ± SEM from at least 10 NMJ from 3 mice * p<0.05 (N=3, n>10, t test two tails. (d) Western blot detection of synaptophysin on protein extracts from different tissues of WT (W, white bars) and MCK (M, grey bars) animals. The relative band intensity was analyzed by Image J. The WT/tubulin ratio was set as 100 %. * p<0.05 (N=3). (e) Western blot detection of the synaptic vesicle 2A on SCM protein extract in WT and MCK mice. (f, g) Volume density of mitochondria within the NMJ was calculated according to Weibel using a D64 grid (q2=16, PT=64, P′T=1024) at 8500x magnification. Individual NMJ data (N=9–16 per mouse) were averaged per mouse and subsequently between mice at the same genotype (WT=4, MCK=3). Unpaired t test. (h) The surface density of mitochondria (right) was calculated according to Weibel using a customized D576 Grid (q2=16, PT=576, P′T=9216).at 8500x magnification. Individual NMJ data (N=9–16 per mouse) were averaged per mouse and subsequently between mice at the same genotype (WT=4, MCK=3). Unpaired t test. (i) For SCM muscle, a kinetic of AChE activity was measured indirectly by detecting the fluorescence emitted at 590 nm for 3600 sec. Each point represents mean ± SEM. (N=3).

References

    1. Lin S, Landmann L, Ruegg MA, Brenner HR. The role of nerve-versus muscle-derived factors in mammalian neuromuscular junction formation. J Neurosci. 2008;28:3333–3340. doi: 10.1523/JNEUROSCI.5590-07.2008. - DOI - PMC - PubMed
    1. Wu H, Xiong WC, Mei L. To build a synapse: signaling pathways in neuromuscular junction assembly. Development. 2010;137:1017–1033. doi: 10.1242/dev.038711. - DOI - PMC - PubMed
    1. Sanes JR, Lichtman JW. Development of the vertebrate neuromuscular junction. Annu Rev Neurosci. 1999;22:389–442. doi: 10.1146/annurev.neuro.22.1.389. - DOI - PubMed
    1. Farrugia ME, Vincent A. Autoimmune mediated neuromuscular junction defects. Curr Opin Neurol. 2010;23:489–495. doi: 10.1097/WCO.0b013e32833cc968. - DOI - PubMed
    1. Hirsch NP. Neuromuscular junction in health and disease. Br J Anaesth. 2007;99:132–138. doi: 10.1093/bja/aem144. - DOI - PubMed

Publication types

MeSH terms

Substances

LinkOut - more resources