. 2014 Apr 1:5:3572.
doi: 10.1038/ncomms4572.

Whisker barrel cortex delta oscillations and gamma power in the awake mouse are linked to respiration

Affiliations
Free PMC article

Whisker barrel cortex delta oscillations and gamma power in the awake mouse are linked to respiration

J Ito et al. Nat Commun. .
Free PMC article

Abstract

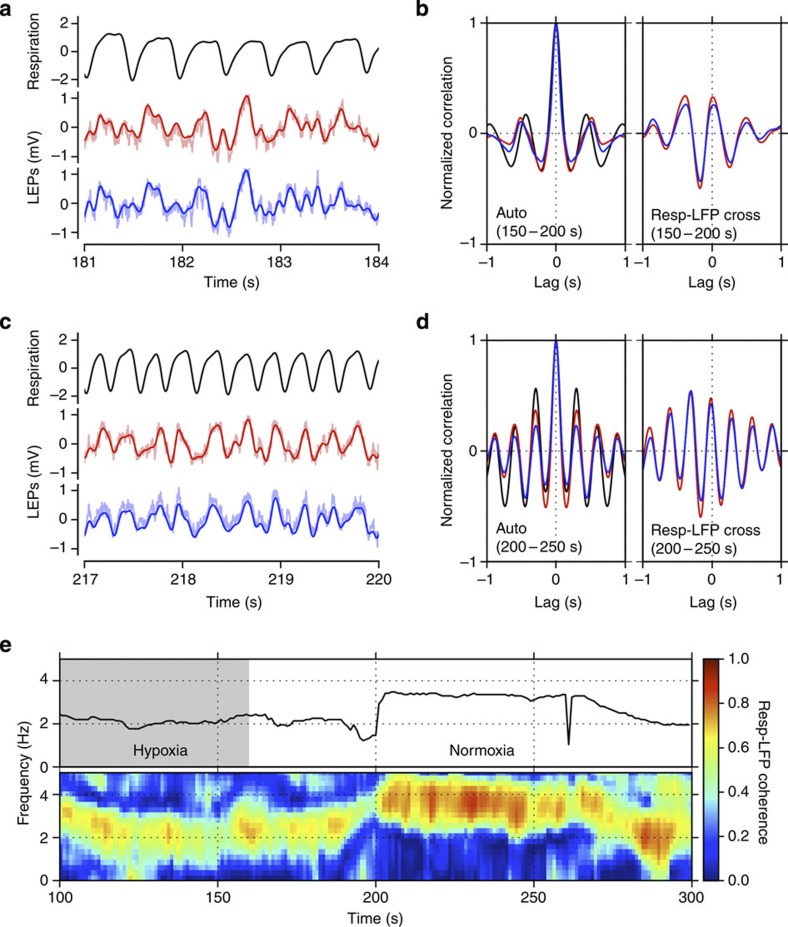
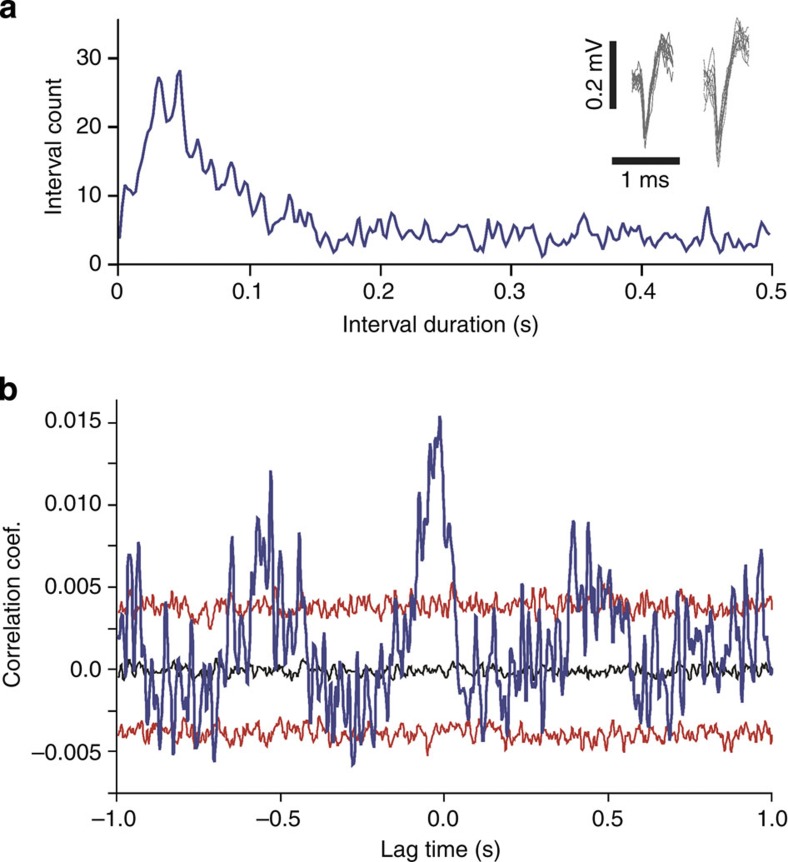
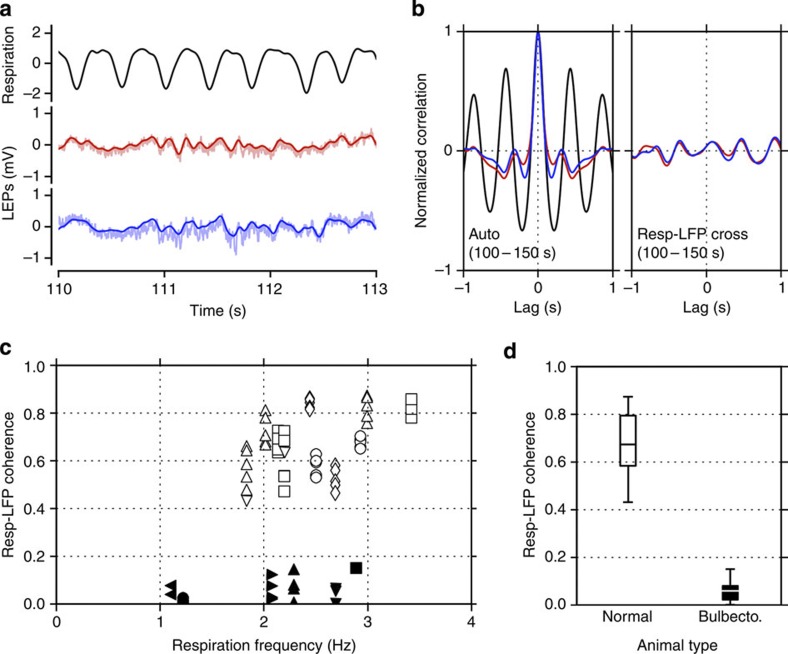
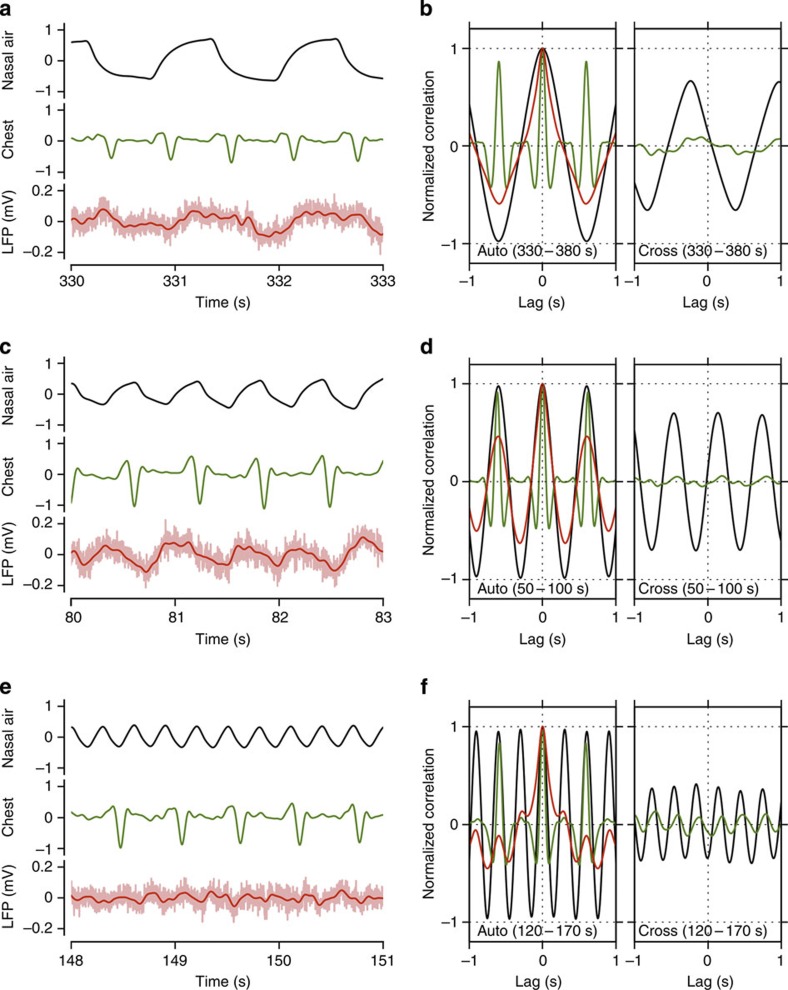
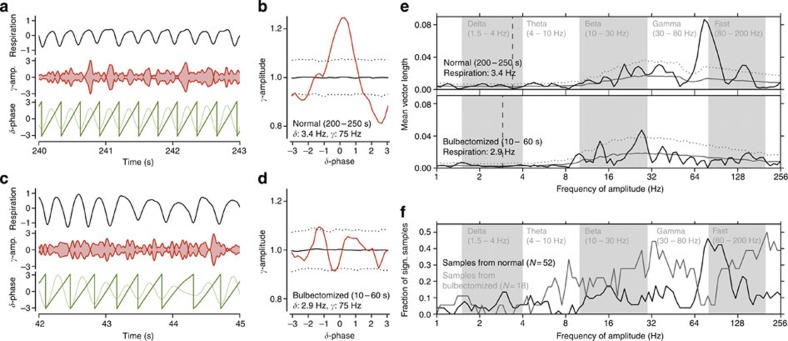
Current evidence suggests that delta oscillations (0.5-4 Hz) in the brain are generated by intrinsic network mechanisms involving cortical and thalamic circuits. Here we report that delta band oscillation in spike and local field potential (LFP) activity in the whisker barrel cortex of awake mice is phase locked to respiration. Furthermore, LFP oscillations in the gamma frequency band (30-80 Hz) are amplitude modulated in phase with the respiratory rhythm. Removal of the olfactory bulb eliminates respiration-locked delta oscillations and delta-gamma phase-amplitude coupling. Our findings thus suggest respiration-locked olfactory bulb activity as a main driving force behind delta oscillations and gamma power modulation in the whisker barrel cortex in the awake state.


Figures

Figure 1
Figure 1. Oscillatory neuronal activity phase locks with breathing.
Correlation and coherence between respiratory and local field potential (LFP) signals in barrel cortex in an awake mouse. Data from one mouse are shown, but results were reproduced in five out of five mice. (a) Respiratory rhythm (black) and two LFP signals simultaneously recorded in the whisker barrel cortex (red and blue) at rest. Recording sites were 300 μm apart. (b) Autocorrelations (left) of respiratory and LFP signals and LFP-respiration cross-correlations (right). Curve colours correspond to those in a. (c) Same recordings as in a, but during accelerated breathing induced by brief exposure to hypoxic air. (d) Autocorrelations (left) of respiratory and LFP signals and LFP-respiration cross-correlations (right). Curve colours correspond to those in a. (e) Instantaneous respiration frequency (top) and LFP-respiration coherency (bottom) during normal accelerated breathing elicited by exposure to hypoxic air. Respiration frequency and coherency were computed within 5-s time windows, moved in 2.5-s steps. The coherence was plotted in a pseudo-colour code shown on the right. Grey background in top panel indicates time of exposure to hypoxic air. Data shown in a and c are two 3-s segments of the full data range shown in e (the time axes in a and c are common with the one in e).
Figure 2
Figure 2. Spike activity is rhythmically correlated with respiration.
Single- (n=3) and multi-unit (n=9) spike activity was recorded in the whisker barrel cortex of two awake mice. The cross-correlations of spike activity with breathing was significant for 3/3 single units and 8/9 multi-unit recordings. (a) Inter-spike interval histogram of single-unit spike activity recorded over 10 min in the whisker barrel cortex of an awake mouse. Inset shows overlays of waveforms of the first (left) and last (right) 10 action potentials. (b) Cross-correlation of single-unit spike activity with respiration (time of onset of the inspiratory cycle). The blue line represents the raw cross-correlation. The black line represents the median of the distribution of surrogate correlations. Top and bottom red lines represent the 5th and 95th percentile of the surrogate correlation distribution, respectively (see Methods or details). Raw correlations were considered significant if cross-correlation values exceeded the 5 or 95 percentile boundaries of the surrogate correlation distributions.
Figure 3
Figure 3. Olfactory bulb activity drives cortical oscillations.
Reduction of coherence between respiration and local field potential (LFP) signals in intact and olfactory bulbectomized mice recorded in awake, head-fixed conditions. (a) Respiration (black) measured as the temperature in front of the mouse’s nostrils and simultaneously recorded LFP signals (red and blue) in the barrel cortex of a bulbectomized mouse. The respiration signal was normalized by subtraction of the mean and division by the s.d. (b) Autocorrelations (left) of the LFP and respiratory signals shown in a and cross-correlations (right) between the respiratory signal and either of the LFP signals in a. Red and blue curves represent the cross-correlations obtained from the LFPs drawn by the corresponding colour in a. (c) Coherence between respiratory signals and LFP signals plotted against respiration frequency. Individual data points represent the coherence within a data segment of 50 s between respiration and the simultaneously recorded LFP signal. Different symbols represent different mice, and white and black symbols represent intact and bulbectomized mice, respectively. A total of 52 and 18 50-s segments were sampled from five intact and six bulbectomized mice, respectively. Multiple identical symbols represent multiple parallel LFP measurements (with up to five electrodes in the whisker barrel cortex) or multiple LFP samples from the same recording site in one mouse. Each symbols position along the x axis is determined by the average respiratory rate during the corresponding 50-s segment. (d) Summary of the data shown in c. White and black box-and-whisker plots represent the means (ticks inside the boxes), the 1st and 3rd quartiles (bottom and top ends of the boxes) and the extents of the data (whiskers) for the white and black data points in c, respectively.
Figure 4
Figure 4. Nasal airflow is required to link respiration to cortical oscillations.
Local field potential (LFP) oscillations in whisker barrel cortex related to nasal airflow in an anaesthetized tracheotomized mouse. Data are shown from one mouse, but results were reproduced in 3/3 mice. (a) Raw signals representing nasal airflow modulated at 0.8 Hz through the opening of the ascending trachea (black), spontaneous breathing through the opening of the descending trachea measured as chest movement (green) and barrel cortical LFP (light red: raw signal, red: filtered in 0.5–10 Hz). (b) Autocorrelations (left) of the signals in a with the same colour convention, and cross-correlations (right) of the filtered LFP signal to the nasal airflow (black) and to the chest movement (green). All the correlations were computed from data segments of 50 s duration that include the traces shown in a, as indicated by the labels within the panels. (c) As in a with nasal airflow modulated at 1.6 Hz. (d) Auto- and cross-correlations as in b for the signals in c. (e) As in a with nasal airflow modulated at 3.2 Hz. (f) Auto- and cross-correlations as in b for the signals in e. The units of the nasal airflow and the chest movement are arbitrary, but common across a,c and e.
Figure 5
Figure 5. Electrical stimulation of the olfactory bulb entrains cortical activity.
(a) Average barrel cortical LFP response to electrical stimulation of the ipsilateral olfactory bulb with a 0.8-Hz rhythmic stimulus. The stimulus consisted of 50 Hz trains of 10-ms current steps (50 μA) repeated every 1.25 s (=0.8 Hz). The arrow points to the onset of the stimulus train. Electrical stimulation artefacts (marked by curly brackets labelled stim.artif.) appear as dense vertical lines truncated at the bottom. LFP signals were averaged across 30 stimulus trains. The LFP increased during bulbar stimulation and decreased again during the inter-train interval. The average LFP response amplitude was measured as the difference between the voltage at the time of the onset and end of the stimulus train in the averaged signal, as marked by the two dashed horizontal lines. (b) Average barrel cortical LFP response to the same stimulus as in a but with a higher stimulus current (80 μA). The LFP increased faster with higher stimulus current. (c,d) Average barrel cortical LFP response to bulbar stimulation (80 μA) at 1.6 Hz (c) and 3.2 Hz (d). In all cases, bulbar stimulation was through a concentric bipolar electrode (SNEX 100x, Kopf Instruments, USA). Stimulus timing was controlled using Spike2 software and the D/A output of the CED 1401 (both Cambridge Electronic Design, UK) and stimulus currents were generated by a battery driven stimulus isolation unit (A380, World Precision Instruments, USA). (e) Average LFP responses measured as described in a to three different stimulus frequencies at two different stimulus currents. Responses to each stimulus frequency-current combination were measured in three mice. Response amplitudes are normalized to each animal’s maximum response to the 0.8 Hz/80 μA stimulus and averaged across the three mice. Response amplitude was a function of stimulus current and stimulus frequency. Error bars show s.e.m.
Figure 6
Figure 6. Respiratory modulation of power in high-frequency oscillations.
Phase–amplitude coupling between respiration-locked delta and gamma band oscillations in the barrel cortical LFP activity of an awake intact and an awake bulbectomized mouse, followed by population statistics. (a) Respiratory activity (top trace), amplitude of gamma band oscillations (middle trace) and delta oscillations (light green bottom trace) and its phase (dark green bottom trace) in an intact mouse. Gamma oscillation (75 Hz) amplitude peaks rhythmically phase locked to the delta cycle. (b) Gamma oscillation amplitude as a function of delta phase (red). The solid and dotted black lines indicate the mean and the 2.5 and 97.5 percentile boundaries of the surrogate amplitude distribution estimated from 1000 phase-randomized surrogates. Gamma amplitude modulation is significant at phase 0 of the delta cycle. (c,d) Same as a,b, respectively, but for a bulbectomized mouse. After removal of the olfactory bulb, the amplitude modulation of the gamma band oscillations is no longer phase locked to respiration. (e) Quantitative analysis of phase–amplitude coupling by the mean vector length (MVL, solid black lines) between the phase of the respiratory (delta) frequency and the amplitudes of a range of frequencies from 1 to 256 Hz (logarithmically scaled). Grey and white backgrounds delineate commonly used frequency band boundaries. The solid and dotted grey lines indicate the mean and the 95 percentile, respectively, of surrogate mean vector length values estimated from 1,000 phase-randomized surrogates. (f) Population statistics of respiration-LFP phase–amplitude coupling in intact and bulbectomized mice. MVL values were computed from the same set of LFP segments as used in the coherence analysis in Fig. 2c (52 samples from five intact and 18 samples from six bulbectomized mice). The graphs represent the fraction of samples exceeding the 95 percentile boundary of the surrogate MVL value distribution in intact (black) and bulbectomized mice (grey) plotted as a function of amplitude frequency (logarithmically scaled). Phase frequency was fixed at the respiratory frequency.
Figure 7
Figure 7. Retrograde tracing of barrel cortical afferents.
Representative images showing retrograde labelling in the forebrain following injection of a retrograde tracer (Fluorogold) into barrel cortex. (a) Injection site in S1BF (barrel cortex). (b) Retrogradely labelled cells were not found in the piriform cortex (PC). Retrogradely labelled neurons are found primarily in layers 2,3 and 5 in the contralateral barrel cortex (c), ipsilateral ventral posteromedial (VPM) thalamus (d), adjacent ipsilateral S2 (somatosensory) cortex (e). There is also sparse labelling of neurons ipsilaterally in basal forebrain (BF) nuclei (f). IC, internal capsule; LH, lateral hypothalamus; VPL, ventral posterolateral thalamus; VL, ventral lateral thalamus. Scale bars, (a), 400 μm. (bf), 100 μm. Images ac and df are from different mice.

References

    1. Buzsaki G. Rhythms of the Brain Oxford University Press (2006).
    1. Buzsaki G. & Draguhn A. Neuronal oscillations in cortical networks. Science 304, 1926–1929 (2004). - PubMed
    1. Buzsaki G. & Wang X. J. Mechanisms of gamma oscillations. Annu. Rev. Neurosci. 35, 203–225 (2012). - PMC - PubMed
    1. Amzica F. & Steriade M. Electrophysiological correlates of sleep delta waves. Electroencephalogr. Clin. Neurophysiol. 107, 69–83 (1998). - PubMed
    1. Timofeev I. & Chauvette S. Thalamocortical oscillations: local control of EEG slow waves. Curr. Top. Med. Chem. 11, 2457–2471 (2011). - PubMed

Publication types