. 2014 May;17(5):694-703.
doi: 10.1038/nn.3691. Epub 2014 Mar 30.

Astrocyte Kir4.1 ion channel deficits contribute to neuronal dysfunction in Huntington's disease model mice

Affiliations

Astrocyte Kir4.1 ion channel deficits contribute to neuronal dysfunction in Huntington's disease model mice

Xiaoping Tong et al. Nat Neurosci. 2014 May.

Abstract

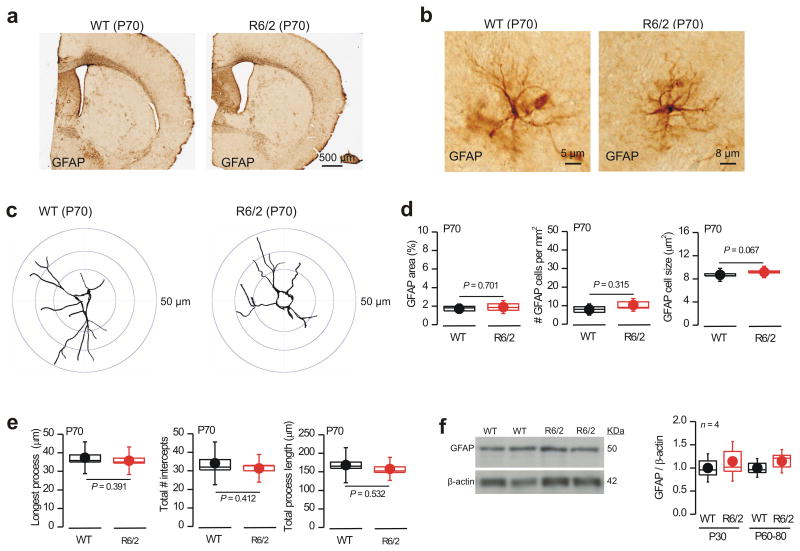
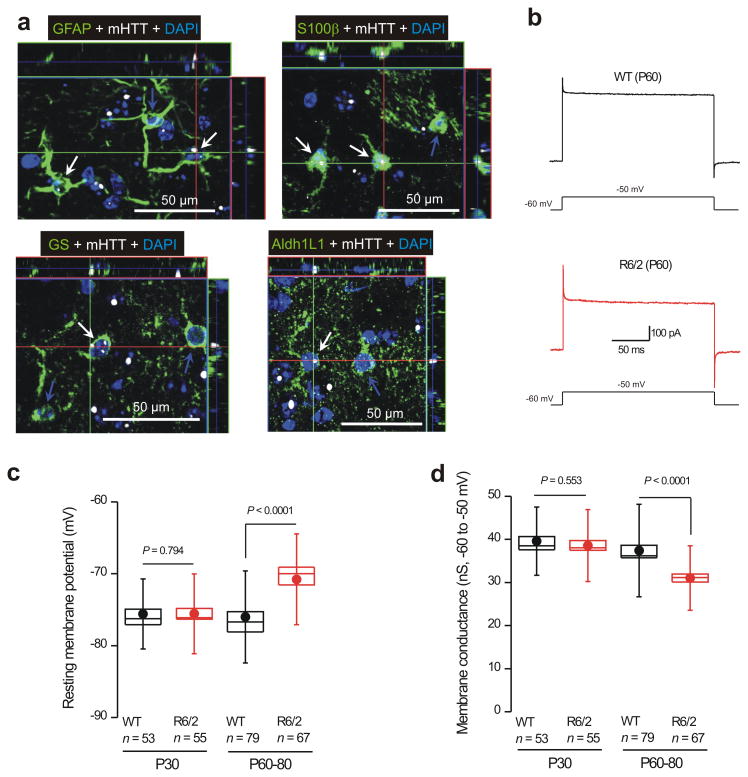
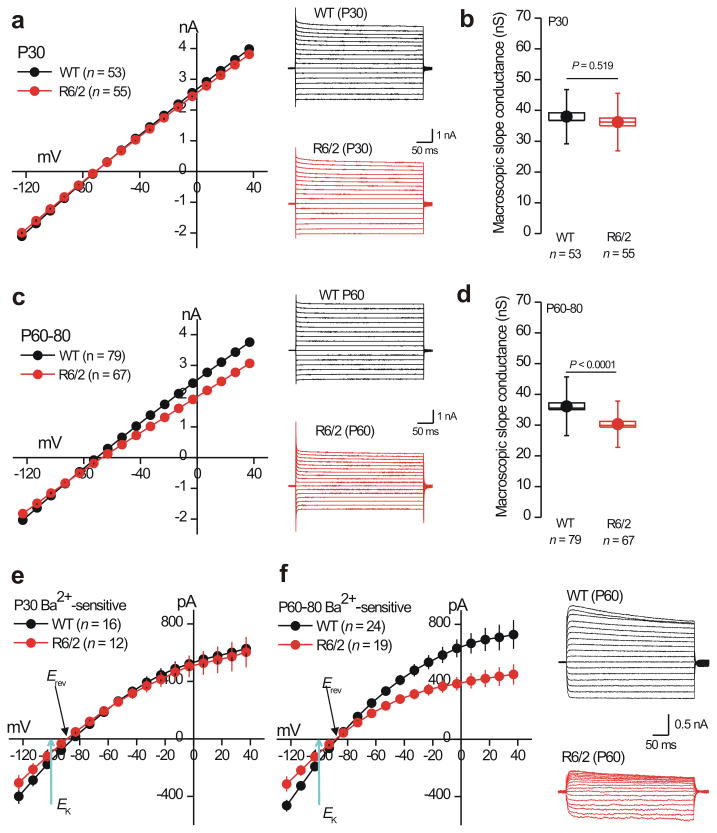
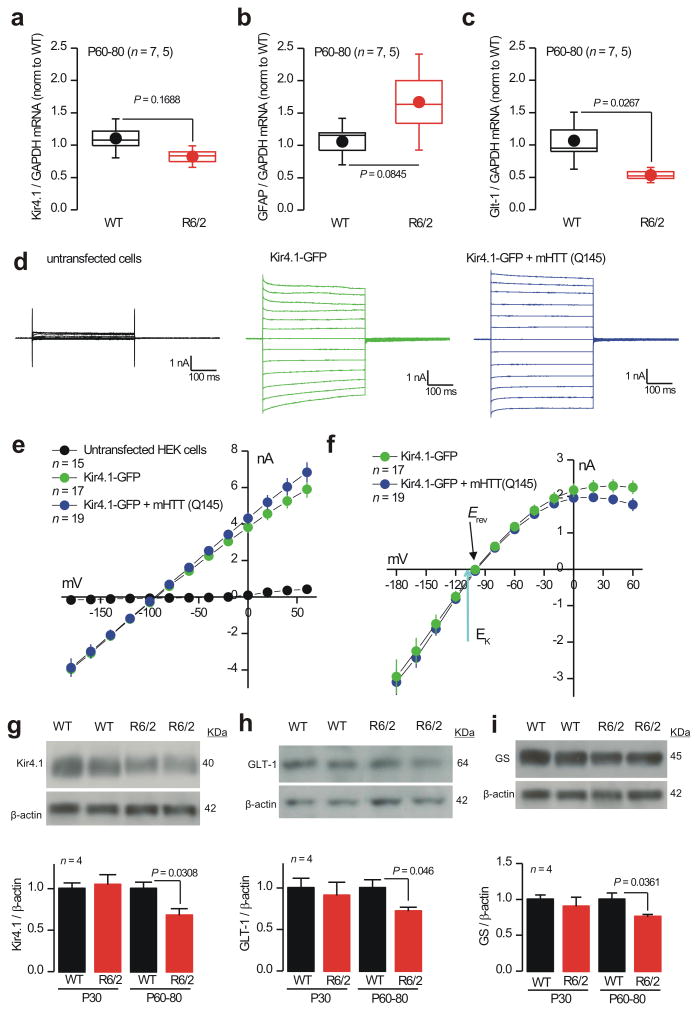
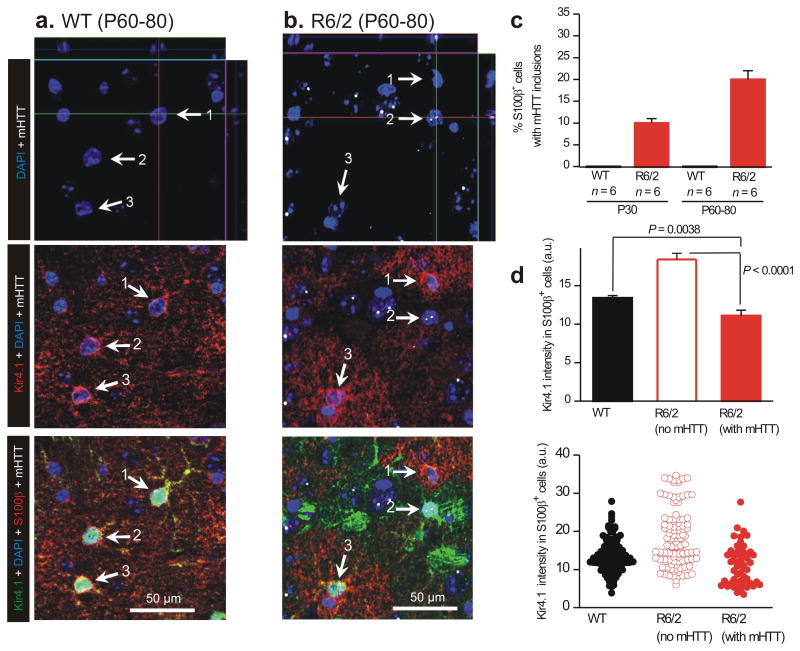
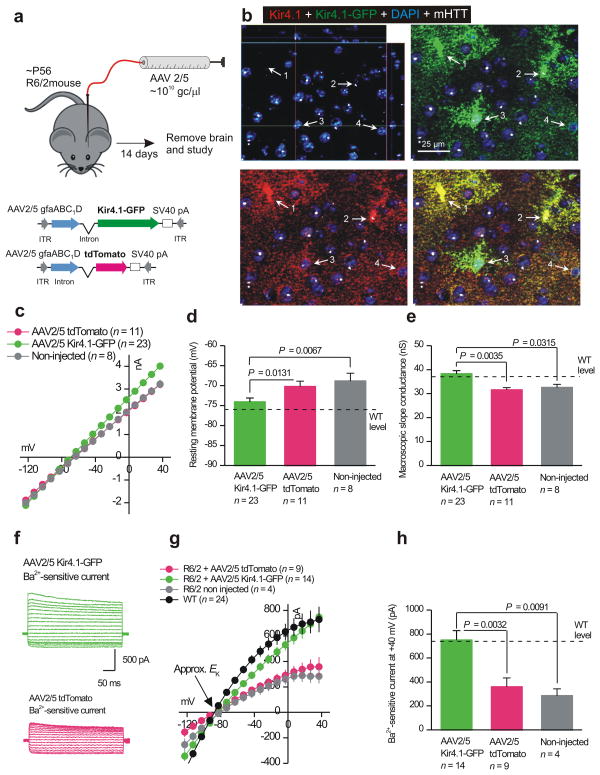
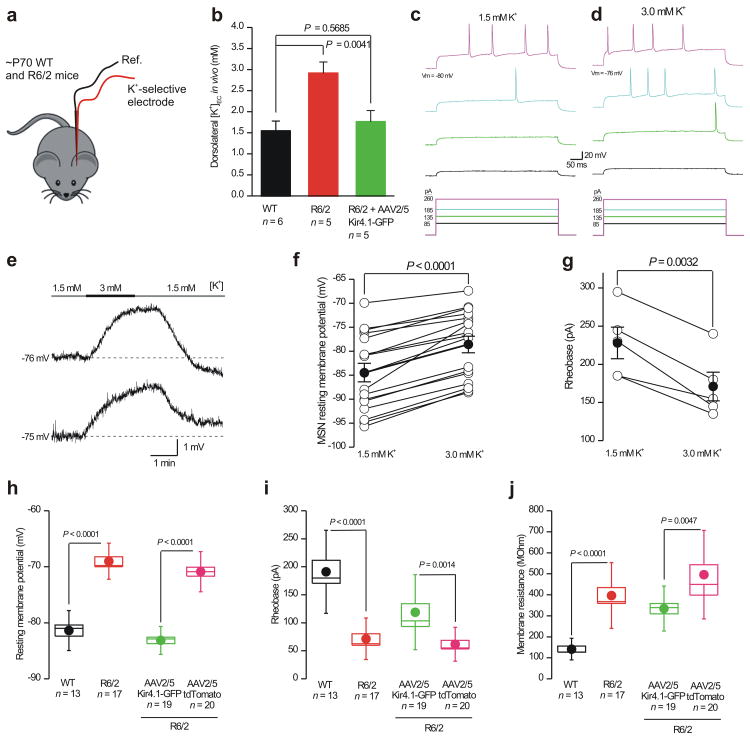
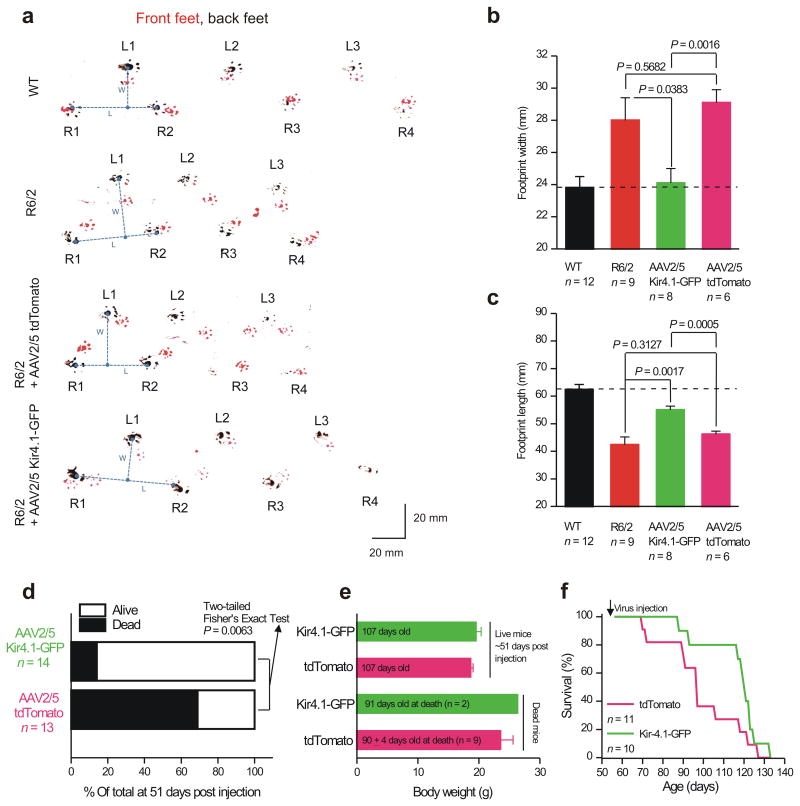
Huntington's disease (HD) is characterized by striatal medium spiny neuron (MSN) dysfunction, but the underlying mechanisms remain unclear. We explored roles for astrocytes, in which mutant huntingtin is expressed in HD patients and mouse models. We found that symptom onset in R6/2 and Q175 HD mouse models was not associated with classical astrogliosis, but was associated with decreased Kir4.1 K(+) channel functional expression, leading to elevated in vivo striatal extracellular K(+), which increased MSN excitability in vitro. Viral delivery of Kir4.1 channels to striatal astrocytes restored Kir4.1 function, normalized extracellular K(+), ameliorated aspects of MSN dysfunction, prolonged survival and attenuated some motor phenotypes in R6/2 mice. These findings indicate that components of altered MSN excitability in HD may be caused by heretofore unknown disturbances of astrocyte-mediated K(+) homeostasis, revealing astrocytes and Kir4.1 channels as therapeutic targets.


Figures

Figure 1
Figure 1. No evidence for astrogliosis at symptomatic ages in R6/2 mice
a. Brain sections from WT and R6/2 mice at P70 stained for GFAP using the DAB reaction. b. Representative high magnification views of astrocytes from WT and R6/2 mice at P70. R6/2 astrocytes exhibit no evidence of hypertrophy. c. Examples of Sholl analysis for astrocytes stained for GFAP from images such as those in b. d. Quantification of GFAP area, cells per mm2 and soma size for images such as those in b. e. Quantification of key parameters from Sholl analysis for images such as those in c. f. Western blot analysis of GFAP expression in WT and R6/2 mice. The gels show data for P60 (in duplicate), whereas the bar graph summarizes data at P30 and P60–80 (quantification was achieved by normalizing to β–actin). The data shown in this figure were normally distributed and thus statistical significance was assessed by unpaired Student's t test; P values are shown. For the box and whisker plots shown here and elsewhere, the box is S.E.M and the whisker is S.D.
Figure 2
Figure 2. Striatal astrocytes from R6/2 mice display nuclear mHTT inclusions, depolarized membrane potentials and lower membrane conductances
a. Representative immunofluorescence images showing that GFAP, S100β, GS and Aldh1L1 labeled astrocytes (green) from R6/2 mice at P60 contain nuclear mHTT inclusions (nuclei were labeled blue with DAPI and mHTT is shown in white). b Representative traces of whole–cell voltage–clamp recordings from striatal astrocytes from WT and R6/2 mice at P60. The current waveforms show the response to a step depolarization, revealing clear differences between WT and R6/2 astrocytes. c. Graphs show striatal astrocyte resting membrane potentials for WT and R6/2 mice at the indicated ages. d. Membrane conductance between −60 and −50 mV for WT and R6/2 mice at the indicated ages. In c and d, the data are presented as mean ± S.E.M. The data in c and d were not normally distributed and statistical significance was assessed using the non parametric Two–tailed Mann–Whitney test; P values are indicated. For the box and whisker plots shown here and elsewhere, the box is the S.E.M and the whisker is the S.D.
Figure 3
Figure 3. Striatal astrocytes from R6/2 mice display reduced Ba2+–sensitive Kir4.1 currents at symptomatic ages (P60–80)
a. I/V plots for WT and R6/2 striatal astrocytes at P30, with representative traces shown to the right. b. Histograms for membrane slope conductance calculated from the I/V plots for WT and R6/2 mice at P30 (between −120 and +40 mV). c. The graph shows I/V plots for WT and R6/2 striatal astrocytes at P60, with representative traces shown to the right. d. Histograms for membrane slope conductance calculated from I/V plots for WT and R6/2 mice at P60 (between −120 and +40 mV). e. I/V plots for Ba2+–sensitive currents for WT and R6/2 striatal astrocytes at P30. f. I/V plots for Ba2+–sensitive currents for WT and R6/2 striatal astrocytes at P60, with representative traces to the right. For the I/V plots, in some cases the error bars are smaller than the symbols used. In the case of b,d and f the data were not normally distributed and statistical significance was assessed using the non parametric Two–tailed Mann–Whitney test; P values are indicated. For the box and whisker plots shown here and elsewhere, the box is the S.E.M and the whisker is the S.D.
Figure 4
Figure 4. Mechanistic studies of Kir4.1 currents in R6/2 mice and HEK–293 cells
a–c. qPCR data for Kir4.1 (a; gene name KCNJ10), GFAP (b) and Glt–1 (c) normalized to GAPDH levels for WT and R6/2 striatal tissue at P60–80. Additional RT–PCR experiments are shown in Supp Fig 8. d. Representative traces from HEK–293 cells that were untransfected, transfected with Kir4.1–GFP alone or cotransfected with Kir4.1–GFP plus mHTT(Q145). The current waveforms were elicited by step depolarizations from −160 to +60 mV (in 20 mV steps). e. Average I/V plots for experiments like those illustrated in d. f. Average Ba2+–sensitive currents for HEK–293 cells expressing Kir4.1–GFP alone and Kir4.1–GFP plus mHTT(Q145). g. Representative Western blots and average data for Kir4.1 in WT and R6/2 mice at P30 and P60–80. h. As in g, but for GLT–1. i. As in g, but for GS. In the case of g and h, the data were not normally distributed and statistical significance was assessed using the non parametric Mann–Whitney test; P values are indicated. For the box and whisker plots shown here and elsewhere, the box is the S.E.M and the whisker is the S.D.
Figure 5
Figure 5. Kir4.1 immunostaining is reduced in individual striatal astrocytes that contain nuclear mHTT inclusions
a. Representative quadruple color immunofluorescence images of WT striatum at P60–80, labeled in the indicated colors for DAPI, Kir4.1, S100β and mHTT, showing that no cells expressed mHTT. White arrows (1–3) point to S100β positive cells that were also Kir4.1 positive (red). b. As in a, but for R6/2 striatum at P60–80 and showing that many cells were mHTT-positive. Some mHTT positive cells were S100β-positive and had much reduced Kir4.1 immunostaining (e.g. white arrow 2), whereas other S100β-positive cells lacked mHTT and displayed normal Kir4.1 immunostaining (white arrows 1,3). Are the images shown truly representative? When considering this, please note that the absolute intensity in the red channel (for Kir4.1) corresponding to cells 1, 2 and 3 was 28.2, 12.4 and 24.3 arbitrary units. Thus, these representative examples are within the distribution of all the data shown in panel d. Note also that none of the images shown in this figure (or elsewhere) have been adjusted or altered to exaggerate the fluorescence signal of any component channel. c. Plots the percentage of S100β positive cells that also contained mHTT nuclear inclusions in WT and R6/2 mice at P30 and P60–80. d. Plots Kir4.1 immunostaining intensity for WT mice at P60–80, as well as for S100β positive astrocytes that contained or did not contain mHTT. In the case of d the data were not normally distributed and statistical significance was assessed using the non parametric Two–tailed Mann–Whitney test; P values are indicated.
Figure 6
Figure 6. AAV2/5 mediated Kir4.1–GFP expression rescues deficits observed in striatal astrocytes from R6/2 mice at P60–80
a. The cartoon illustrates the viral constructs employed and the general protocol for AAV delivery into the striatum of adult R6/2 mice, which were microinjected at P56 and studied 14 days later. b. Immunostaining for total Kir4.1 (i.e. native Kir.4.1 and that delivered with AAVs) following AAV2/5 Kir4.1–GFP microinjections in R6/2 striatum. Kir4.1 levels are restored to those of WT (see Fig. 5a) in mHTT positive astrocytes. c–e. The graphs show that AAV2/5 mediated delivery of Kir4.1–GFP to astrocytes significantly restored IV relations (c), membrane potentials (d) and membrane slope conductances (e) to control levels from WT mice. f–h. Representative traces (f), average I/V plots (g) and analysis of Ba2+–sensitive currents (h) shows that AAV2/5 mediated delivery of Kir4.1–GFP restored Ba2+–sensitive currents to levels almost identical to WT striatal astrocytes at P60–80. In panel g, the WT data are re plotted from Fig. 3f for comparison purposes. In the case of d, e and h the data were normally distributed and statistical significance was assessed using the unpaired Students t test; P values are indicated.
Figure 7
Figure 7. Elevated striatal extracellular K+ levels in R6/2 mice in vivo and their effects on WT MSN excitability in vitro
a. The cartoon illustrates that we measured K+ concentrations in vivo in the striatum of WT and R6/2 at P60–80 using K+ selective microelectrodes. b. The graph shows K+ concentration measurements from WT, R6/2 and in R6/2 mice that had received Kir4.1–GFP. c–g. Representative traces (c,d,e) and average data (f) showing that subtly increasing the extracellular K+ concentration from 1.5 to 3.0 mM significantly depolarized MSNs, leading to a decrease in the depolarizing current needed to evoke action potentials (c,d) and significantly lowering the rheobase (g). h–j. Histograms show differences in the basic properties of MSNs from WT and R6/2 mice and the basic MSN properties from R6/2 mice that were injected with AAV2/5 Kir4.1–GFP versus those that received AAV2/5 tdTomato. In the case of f–j, the data were normally distributed and statistical significance was assessed using the paired (f,g) and un paired (h–j) Student's t tests; P values are indicated. For the box and whisker plots shown here and elsewhere, the box is S.E.M and the whisker is S.D.
Figure 8
Figure 8. AAV2/5 mediated Kir4.1–GFP expression attenuates a motor phenotype in R6/2 mice at P92
a. Representative raw data for footprint tracks of mice walking on paper with their front and rear paws painted with red and black paint, respectively. b–c. Average data from experiments such as those shown in (a) for footprint length and width. AAV2/5 Kir4.1–GFP significantly improved stride length and width in relation to R6/2 mice and in relation to mice that received control AAV2/5 tdTomato virus microinjections. In the case of b and c the data were normally distributed and statistical significance was assessed using un paired Student's t tests; P values are indicated. d. Statistical analysis of mouse survival for the indicated conditions: more mice survived from the pool that received AAV2/5 Kir4.1–GFP. e. Analysis of body weights (for dead and living mice) for the indicated conditions: there were no differences. f. Survival curves for R6/2 mice that received AAV2/5 tdTomato and AAV2/5 Kir4.1–GFP.

Comment in

References

    1. Kuffler SW. Neuroglial cells: physiological properties and a potassium mediated effect of neuronal activity on the glial membrane potential. Proc R Soc Lond B Biol Sci. 1967;168:1–21. - PubMed
    1. Barres BA. The mystery and magic of glia: a perspective on their roles in health and disease. Neuron. 2008;60:430–440. - PubMed
    1. Ransom BR, Ransom CB. Astrocytes: multitalented stars of the central nervous system. Methods Mol Biol. 2012;814:3–7. - PubMed
    1. Maragakis NJ, Rothstein JD. Mechanisms of Disease: astrocytes in neurodegenerative disease. Nat Clin Pract Neurol. 2006;2:679–689. - PubMed
    1. Ilieva H, Polymenidou M, Cleveland DW. Non-cell autonomous toxicity in neurodegenerative disorders: ALS and beyond. J Cell Biol. 2009;187:761–772. - PMC - PubMed

Publication types

MeSH terms