. 2014 May;46(5):503-509.
doi: 10.1038/ng.2933. Epub 2014 Mar 30.

Gain-of-function mutations in IFIH1 cause a spectrum of human disease phenotypes associated with upregulated type I interferon signaling

Affiliations

Gain-of-function mutations in IFIH1 cause a spectrum of human disease phenotypes associated with upregulated type I interferon signaling

Gillian I Rice et al. Nat Genet. 2014 May.

Abstract

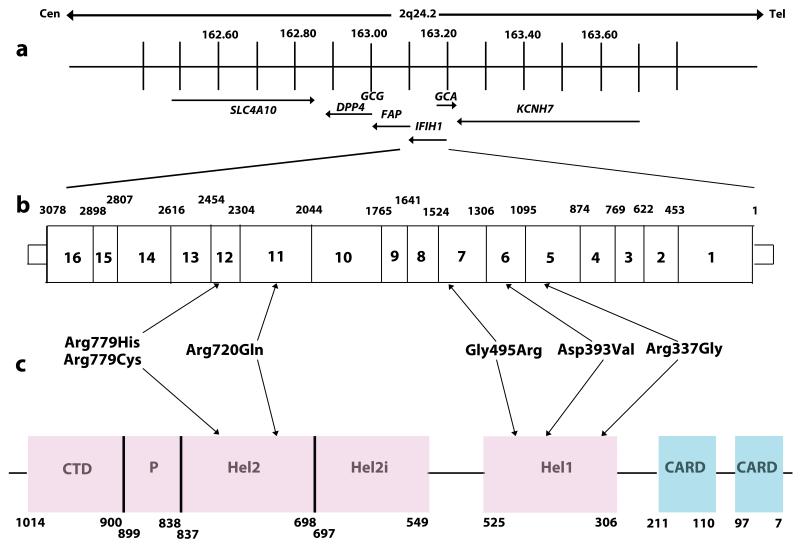
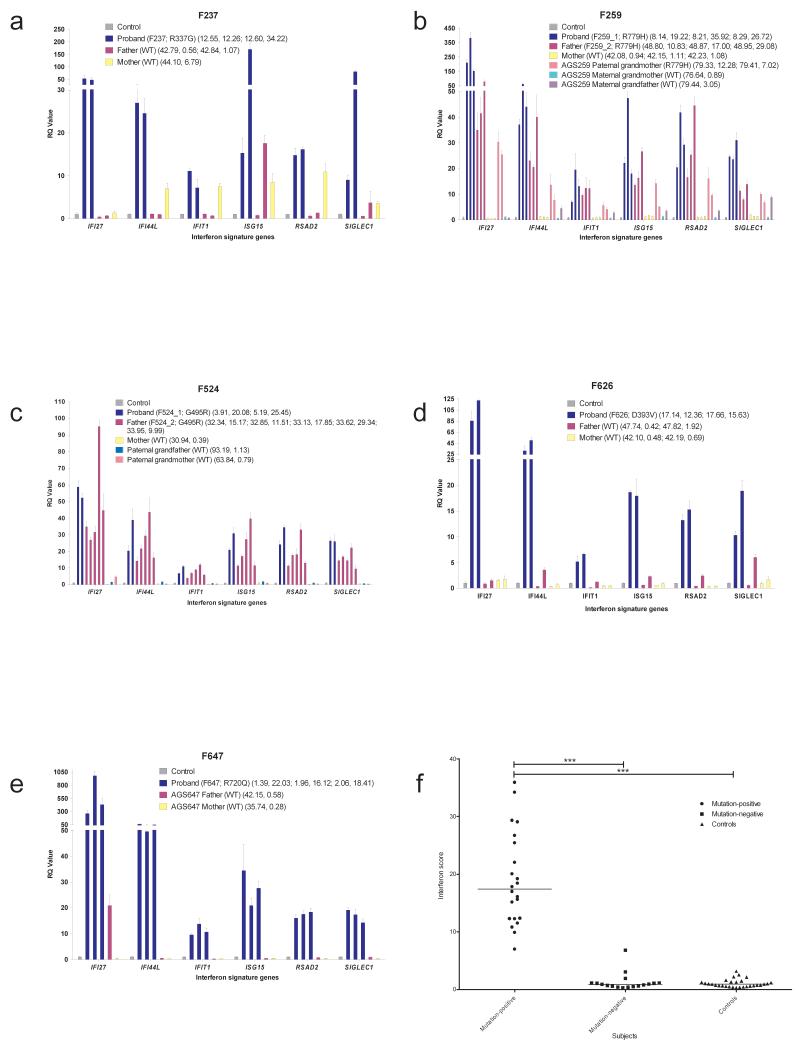
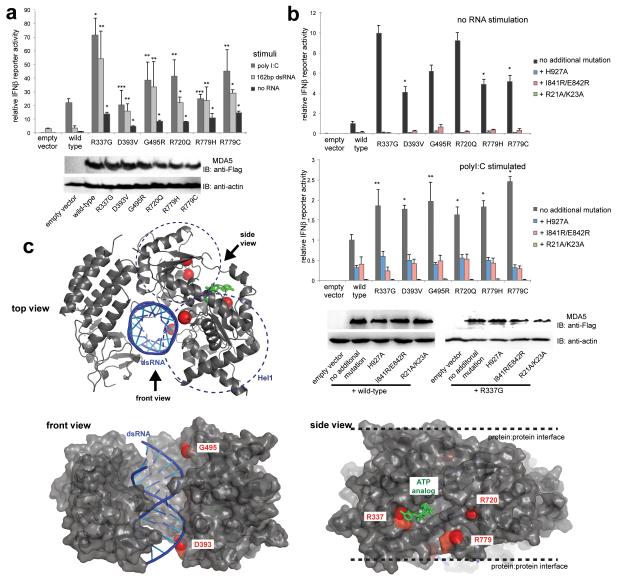
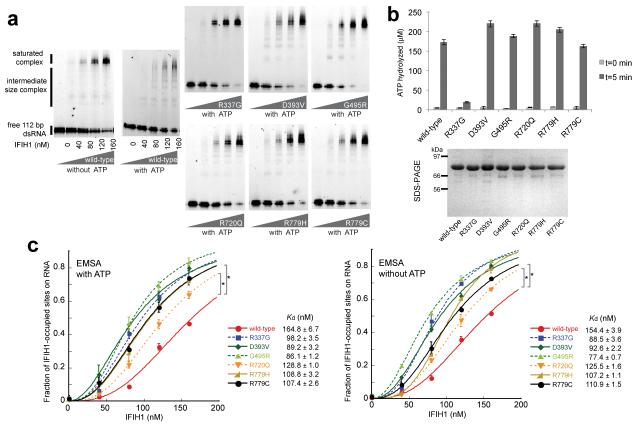
The type I interferon system is integral to human antiviral immunity. However, inappropriate stimulation or defective negative regulation of this system can lead to inflammatory disease. We sought to determine the molecular basis of genetically uncharacterized cases of the type I interferonopathy Aicardi-Goutières syndrome and of other undefined neurological and immunological phenotypes also demonstrating an upregulated type I interferon response. We found that heterozygous mutations in the cytosolic double-stranded RNA receptor gene IFIH1 (also called MDA5) cause a spectrum of neuroimmunological features consistently associated with an enhanced interferon state. Cellular and biochemical assays indicate that these mutations confer gain of function such that mutant IFIH1 binds RNA more avidly, leading to increased baseline and ligand-induced interferon signaling. Our results demonstrate that aberrant sensing of nucleic acids can cause immune upregulation.


Figures

Fig. 1
Fig. 1. Schematic representation of the human IFIH1 gene
(a) IFIH1 spans 51,624bp of genomic sequence on chromosome 2q24.2 (163,123,589 - 163,175,213). Neighboring genes are also shown. (b) Position of identified variants within the genomic sequence of IFIH1. Exons are numbered within the boxes. Numbers given above the gene indicate the exon boundaries using cDNA numbering. (c) Schematic illustrating the position of protein domains and their amino acid boundaries within the IFIH1 1025 amino acid protein. CARD denotes caspase activation recruitment domain. Hel denotes helicase domains, where Hel1 and Hel2 are the two conserved core helicase domains, and Hel2i is an insertion domain that is conserved in the RIG-I like helicase family. P denotes pincer or bridge region which connects Hel2 to the C-terminal domain (CTD) involved in binding double stranded RNA.
Fig. 2
Fig. 2. Quantitative reverse transcription PCR (qPCR) of a panel of six interferon stimulated genes (ISGs) in whole blood measured in IFIH1 mutation-positive probands and mutation-negative relatives and interferon scores in mutation-positive individuals, mutation-negative relatives and controls
(a – e) Bar graphs showing relative quantification (RQ) values for a panel of six interferon stimulated genes (ISGs) (IFI27, IFI44L, IFIT1, ISG15, RSAD2, SIGLEC1) measured in whole blood in five AGS families, compared to the combined results of 29 healthy controls. RQ is equal to 2−ΔΔCt, with −ΔΔCt ± standard deviations (i.e. the normalized fold change relative to a calibrator). Each value is derived from three technical replicates. Family / patient number followed by mutation status are given in the first brackets. Numbers in second brackets refer to decimalized age at sampling, followed by interferon score calculated from the median fold change in relative quantification value for the panel of six ISGs. Colors denote individuals, with repeat samples (biological replicates) denoted by different bars of the same color. (f) Interferon score in all patients, relatives and controls calculated from the median fold change in relative quantification (RQ) value for a panel of six interferon-stimulated genes (ISGs). For participants with repeat samples, all measurements are shown. Black horizontal bars show the median interferon score in mutation-positive, mutation-negative and control individuals. Data analyzed by one-way ANOVA using Bonferroni’s multiple comparison test (**** p<0.0001).
Fig. 3
Fig. 3. IFIH1 mutants activate the interferon signaling pathway more efficiently than wild-type IFIH1
(a) Interferon beta (IFNβ) reporter activity (mean ± SD, n = 3) of Flag-tagged wild-type and mutant IFIH1 with and without stimulation with poly I:C or 162 bp dsRNA in HEK293T cells. The results are representative of three independent experiments. *P<0.005, **P<0.05 and ***P <0.5 (one tailed, unpaired t test, compared with wild-type values). Below are the anti-Flag (F7425, Sigma-Aldrich) and anti-actin (A5441, Sigma-Aldrich) western blots indicating the expression levels of IFIH1 and the internal control (actin), respectively. (b) IFNβ reporter activity (mean ± SD, n = 3) of mutant IFIH1 with and without additional mutations (H927A, I841R/E842R or R21A/K23A) that disrupt RNA binding, filament formation or 2CARD signal activation by IFIH1. Reporter activity was measured in the absence (top) and presence (bottom) of poly I:C stimulation in HEK293T cells. 10 and 20 ng IFIH1 expression constructs were used with and without poly I:C, respectively. The results are representative of three independent experiments. *P<0.005, **P<0.05 (one tailed, unpaired t test). Below are western blots showing the expression levels of wild-type and R337G IFIH1 with and without H927A, I841R/E842R and R21A/K23A. (c) Mapping of the mutated residues (red spheres) onto the structure of IFIH1Δ2CARD (grey) bound by dsRNA (blue) and ATP analog (green). PDB:4GL2.
Fig. 4
Fig. 4. IFIH1 mutants form filaments
(a) Electrophoretic mobility shift assay (EMSA) of purified wild-type and mutant IFIH1 with 112 bp dsRNA. Gel images are representative of three independent experiments. (b) ATP hydrolysis activity (mean ± SD, n = 3) of wild-type and mutant IFIH1. Shown below is the SDS-PAGE analysis (Coomassie stain) of the purified wild-type and mutant IFIH1 used in Fig. 3. (c) Fraction of IFIH1-occupied sites on 112 bp dsRNA, measured from three independent EMSA performed in the presence and absence of ATP. *P<0.0002 (one tailed, unpaired t test), calculated using the values at 160 nM IFIH1. Bound fraction was calculated as in ref , and fitted with the Hill equation. The dissociation constants (Kd) obtained from curve fitting are shown on the right.

Comment in

References

    1. Gresser I, Tovey MG, Maury C, Chouroulinkov I. Lethality of interferon preparations for newborn mice. Nature. 1975;258:76–8. - PubMed
    1. Gresser I, et al. Progressive glomerulonephritis in mice treated with interferon preparations at birth. Nature. 1976;263:420–2. - PubMed
    1. Gresser I, et al. Interferon-induced disease in mice and rats. Ann N Y Acad Sci. 1980;350:12–20. - PubMed
    1. Crow YJ. Type I interferonopathies: a novel set of inborn errors of immunity. Ann N Y Acad Sci. 2011;1238:91–8. - PubMed
    1. Crow YJ, et al. Mutations in the gene encoding the 3′-5′ DNA exonuclease TREX1 cause Aicardi-Goutieres syndrome at the AGS1 locus. Nat Genet. 2006;38:917–20. - PubMed

Publication types

MeSH terms

Supplementary concepts