Comparative Study
. 2014 Feb;57(1):26-45.
doi: 10.1044/1092-4388(2013/12-0103).

Quantitative and descriptive comparison of four acoustic analysis systems: vowel measurements

Comparative Study

Quantitative and descriptive comparison of four acoustic analysis systems: vowel measurements

Carlyn Burris et al. J Speech Lang Hear Res. 2014 Feb.

Abstract

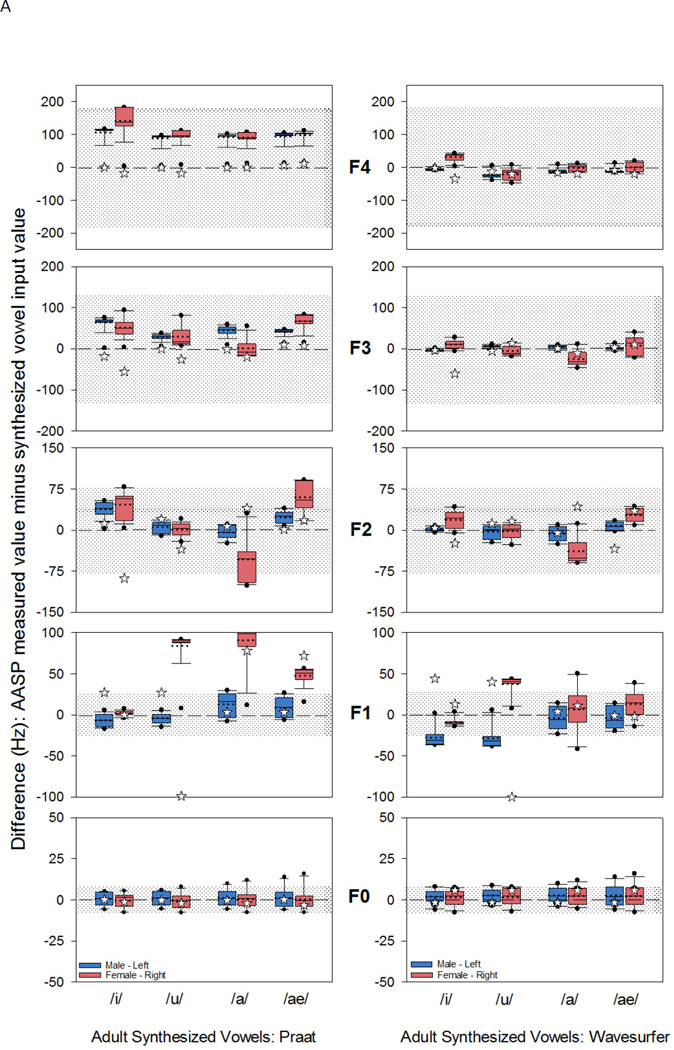
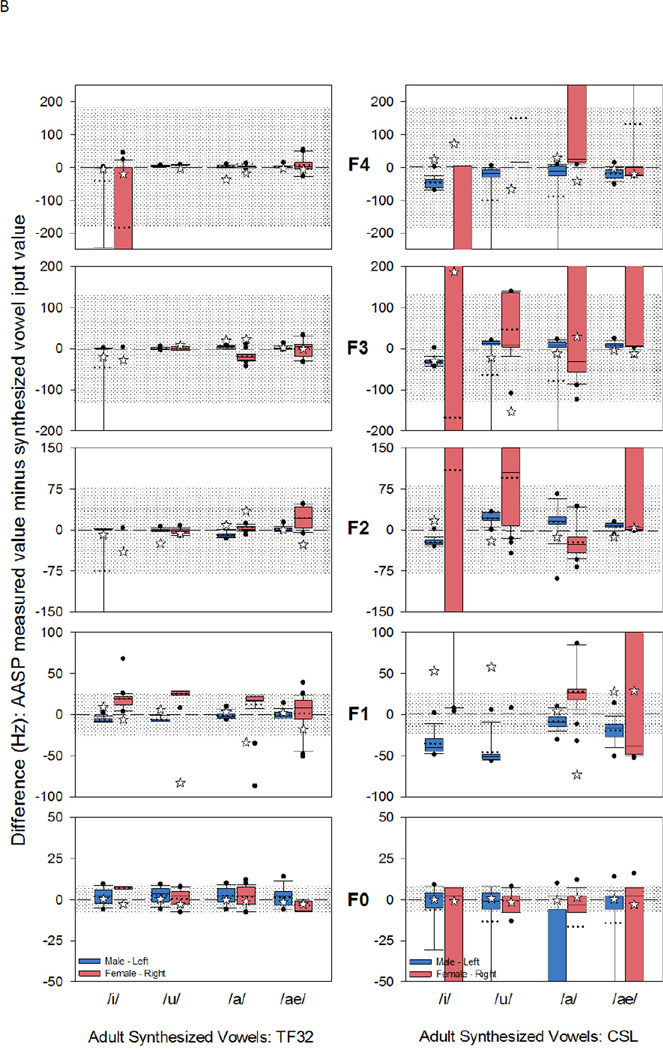
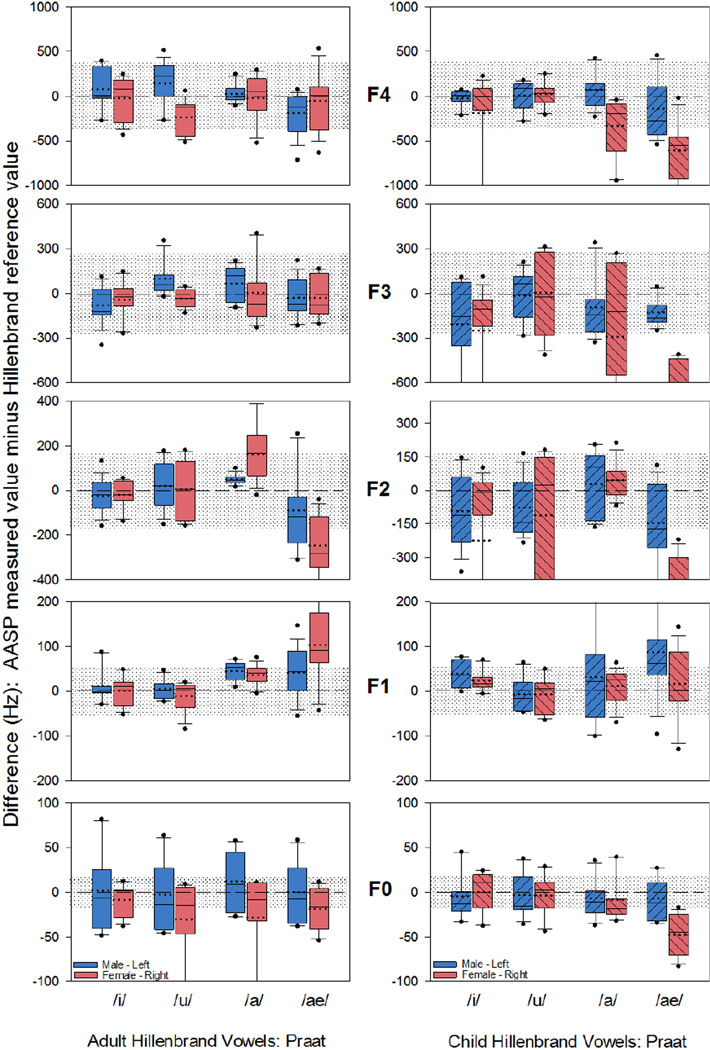
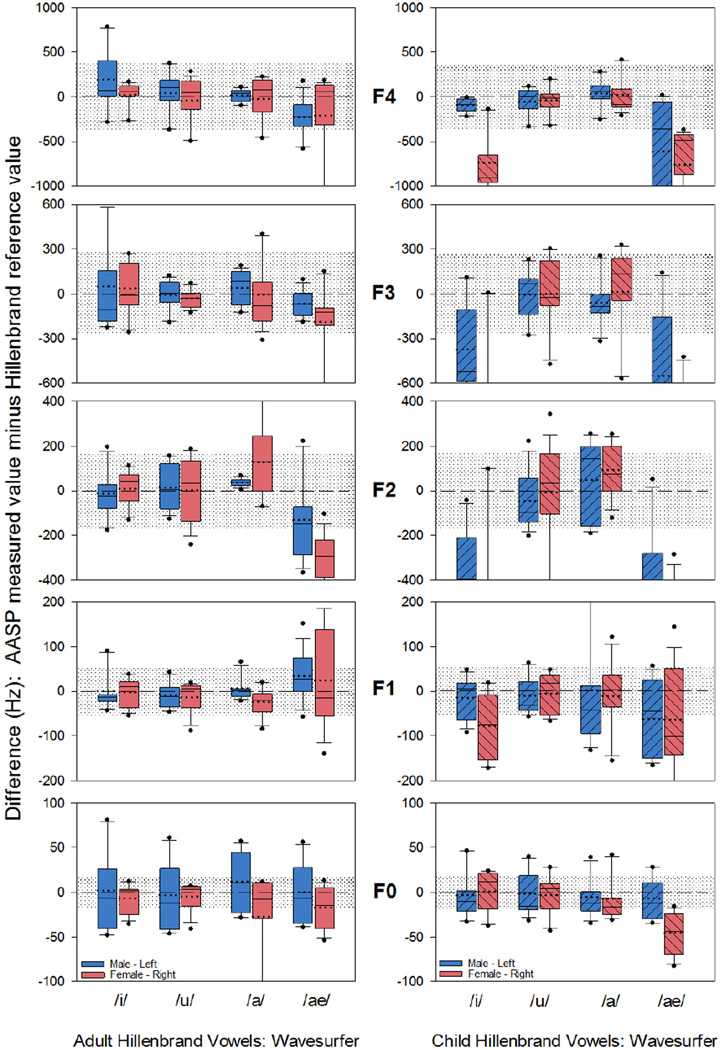
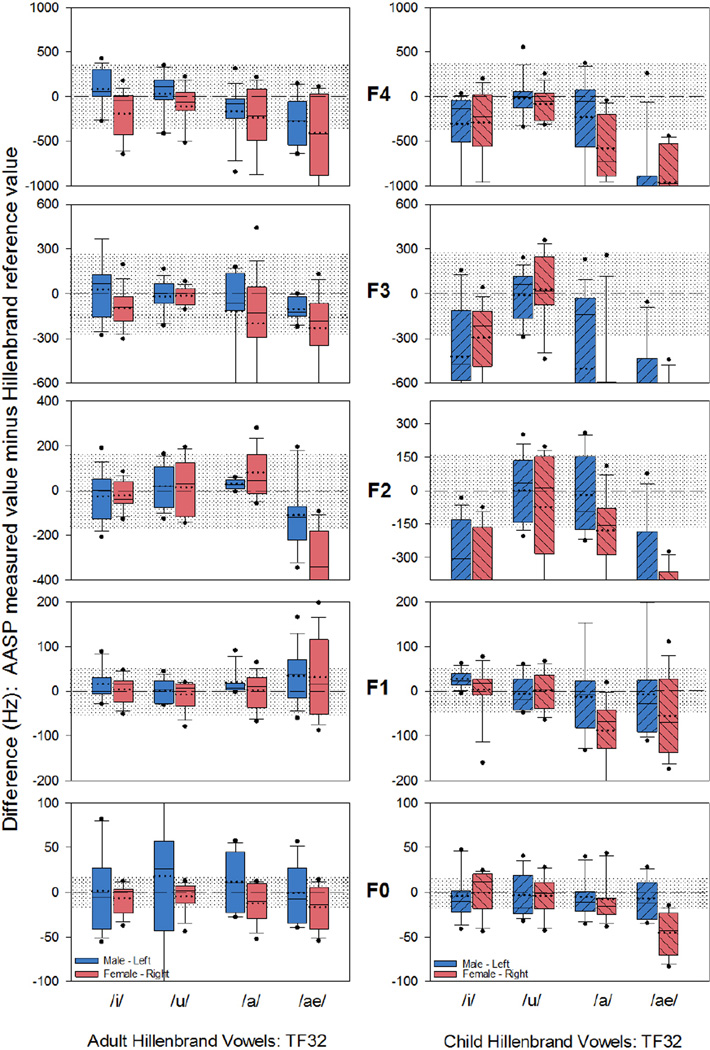
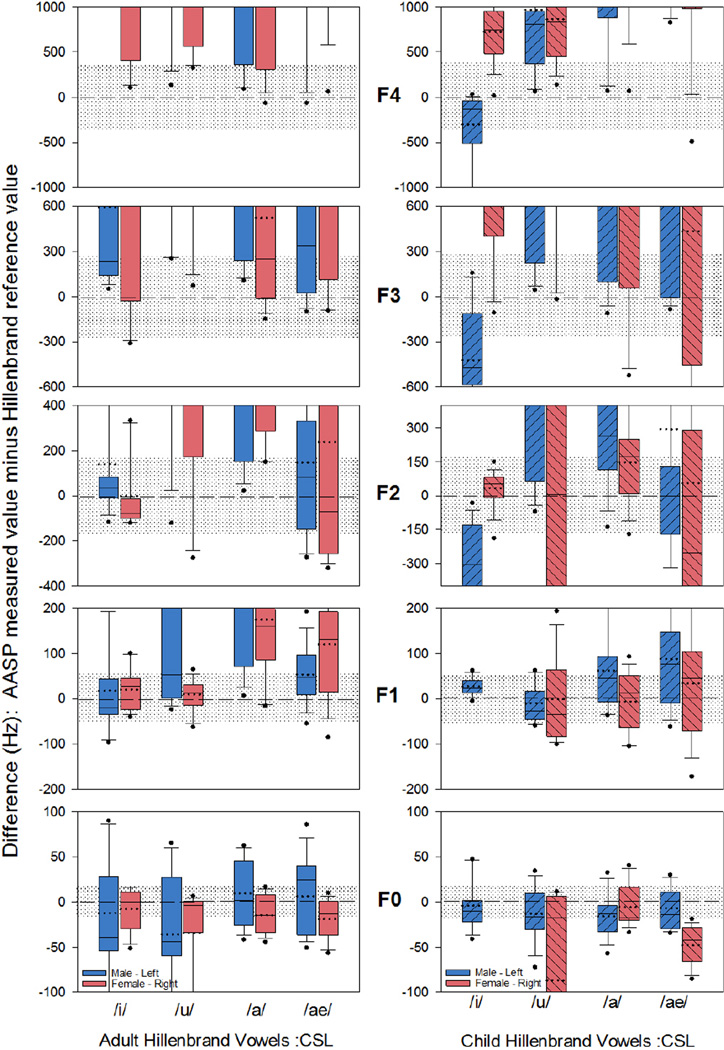
Purpose: This study examines accuracy and comparability of 4 trademarked acoustic analysis software packages (AASPs): Praat, WaveSurfer, TF32, and CSL by using synthesized and natural vowels. Features of AASPs are also described.

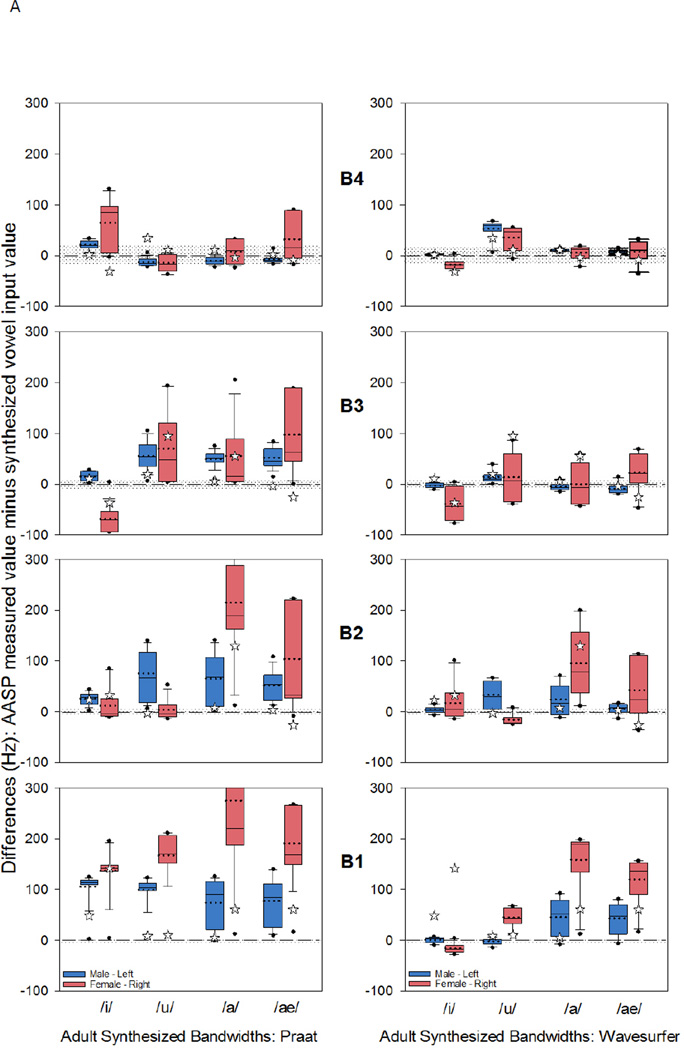
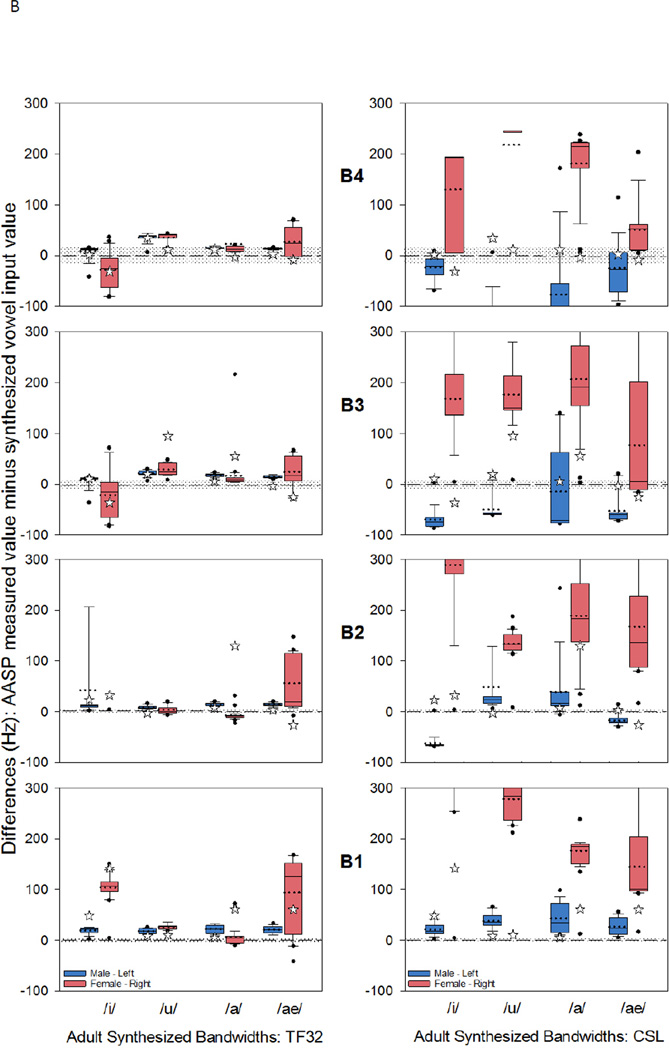
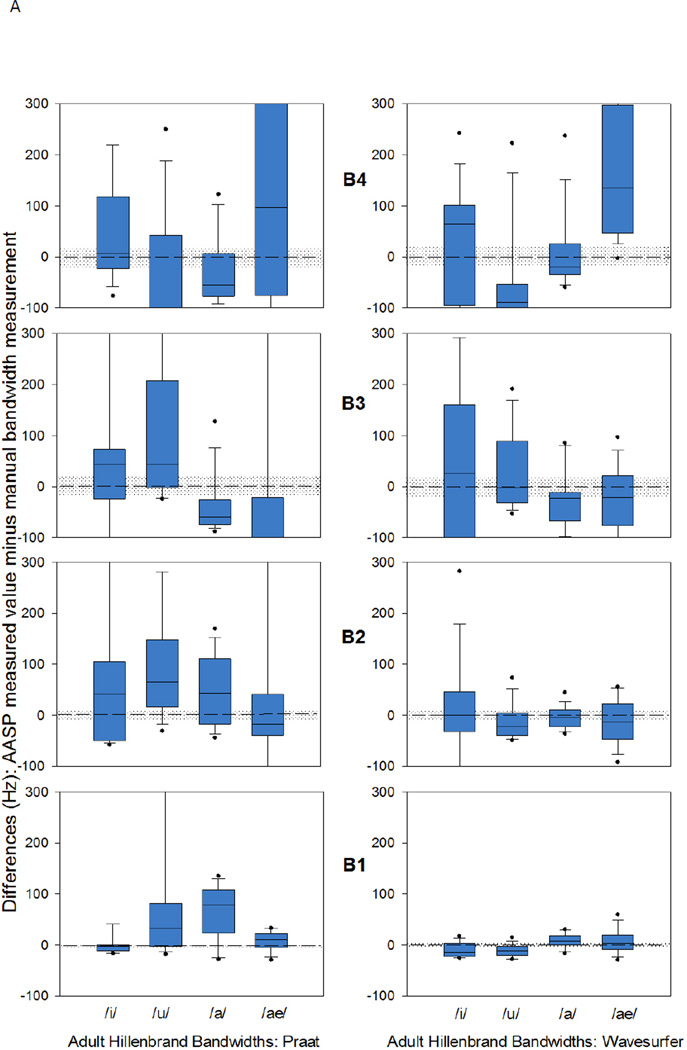
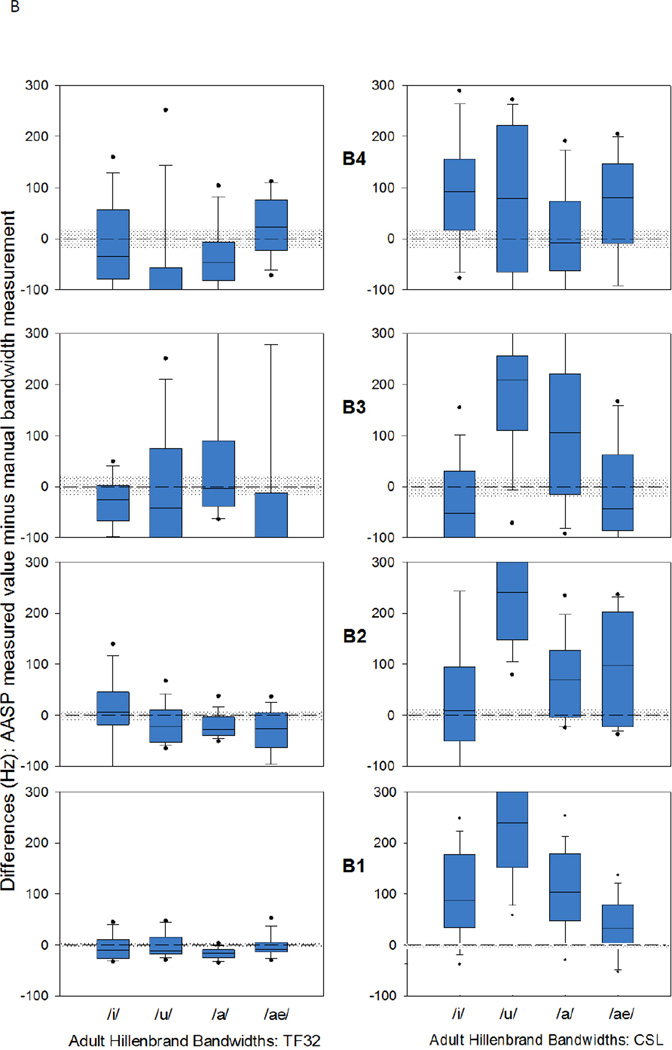
Method: Synthesized and natural vowels were analyzed using each of the AASP's default settings to secure 9 acoustic measures: fundamental frequency (F0), formant frequencies (F1-F4), and formant bandwidths (B1-B4). The discrepancy between the software measured values and the input values (synthesized, previously reported, and manual measurements) was used to assess comparability and accuracy. Basic AASP features are described.

Results: Results indicate that Praat, WaveSurfer, and TF32 generate accurate and comparable F0 and F1-F4 data for synthesized vowels and adult male natural vowels. Results varied by vowel for women and children, with some serious errors. Bandwidth measurements by AASPs were highly inaccurate as compared with manual measurements and published data on formant bandwidths.

Conclusions: Values of F0 and F1-F4 are generally consistent and fairly accurate for adult vowels and for some child vowels using the default settings in Praat, WaveSurfer, and TF32. Manipulation of default settings yields improved output values in TF32 and CSL. Caution is recommended especially before accepting F1-F4 results for children and B1-B4 results for all speakers.


Figures

Figure 1
Figure 1
A. Discrepancy scores for the fundamental frequency (F0) and formant frequencies (F1 to F4) for the four synthesized vowels. The box plots display the 25th and 75th percentile of the discrepancy scores, as well as the mode (solid line) and the median (dotted line). The whiskers display the 5th and 95th percentiles with the outlying data displayed as dots. The zero reference line is the measurement accuracy reference where zero discrepancy indicates no difference between the acoustic analysis software package (AASP) measured value and the input value for the synthesized vowel. The gray region above and below the zero reference line reflects ±5% range of synthesis input value. Manually measured F0 and F1-F4 are displayed with a star symbol. Left panel displays discrepancy scores using Praat, and the right panel Wavesurfer B. Discrepancy scores for the fundamental frequency (F0) and formant frequencies (F1 to F4) for the four synthesized vowels, using TF32 (left panel) and CSL (right panel). The zero or accuracy reference line refers to no difference between the measured value and the input value for the synthesized vowel. Manually measured F0 and F1-F4 are displayed with a star symbol. For additional information regarding box plot or shaded region, refer to Figure 1A caption.
Figure 1
Figure 1
A. Discrepancy scores for the fundamental frequency (F0) and formant frequencies (F1 to F4) for the four synthesized vowels. The box plots display the 25th and 75th percentile of the discrepancy scores, as well as the mode (solid line) and the median (dotted line). The whiskers display the 5th and 95th percentiles with the outlying data displayed as dots. The zero reference line is the measurement accuracy reference where zero discrepancy indicates no difference between the acoustic analysis software package (AASP) measured value and the input value for the synthesized vowel. The gray region above and below the zero reference line reflects ±5% range of synthesis input value. Manually measured F0 and F1-F4 are displayed with a star symbol. Left panel displays discrepancy scores using Praat, and the right panel Wavesurfer B. Discrepancy scores for the fundamental frequency (F0) and formant frequencies (F1 to F4) for the four synthesized vowels, using TF32 (left panel) and CSL (right panel). The zero or accuracy reference line refers to no difference between the measured value and the input value for the synthesized vowel. Manually measured F0 and F1-F4 are displayed with a star symbol. For additional information regarding box plot or shaded region, refer to Figure 1A caption.
Figure 2
Figure 2
A. Discrepancy scores for bandwidth (in Hz) for the four synthesized vowels. The box plots display the 25th and 75th percentile of the discrepancy scores, as well as the mode (solid line) and the median (dotted line). The whiskers display the 5th and 95th percentiles with the outlying data displayed as dots. The zero reference line is the measurement accuracy reference where zero discrepancy implies no difference between the acoustic analysis software package (AASP) measured value and the input value for the synthesized vowel. The gray region above and below the zero reference line reflects ±10% range of synthesis input value. Manually measured B1-B4 are displayed with a star symbol. Left panel displays discrepancy scores using Praat, and the right panel Wavesurfer B. Discrepancy scores for bandwidth (in Hz) for the four synthesized vowels. The box plots display the 25th and 75th percentile of the discrepancy scores, as well as the mode (solid line) and the median (dotted line). The whiskers display the 5th and 95th percentiles with the outlying data displayed as dots. The zero reference line is the measurement accuracy reference where zero discrepancy implies no difference between the acoustic analysis software package (AASP) measured value and the input value for the synthesized vowel. The gray region above and below the zero reference line reflects ±10% range of synthesis input value. Manually measured B1-B4 are displayed with a star symbol. Left panel displays discrepancy scores using Praat, and the right panel Wavesurfer
Figure 2
Figure 2
A. Discrepancy scores for bandwidth (in Hz) for the four synthesized vowels. The box plots display the 25th and 75th percentile of the discrepancy scores, as well as the mode (solid line) and the median (dotted line). The whiskers display the 5th and 95th percentiles with the outlying data displayed as dots. The zero reference line is the measurement accuracy reference where zero discrepancy implies no difference between the acoustic analysis software package (AASP) measured value and the input value for the synthesized vowel. The gray region above and below the zero reference line reflects ±10% range of synthesis input value. Manually measured B1-B4 are displayed with a star symbol. Left panel displays discrepancy scores using Praat, and the right panel Wavesurfer B. Discrepancy scores for bandwidth (in Hz) for the four synthesized vowels. The box plots display the 25th and 75th percentile of the discrepancy scores, as well as the mode (solid line) and the median (dotted line). The whiskers display the 5th and 95th percentiles with the outlying data displayed as dots. The zero reference line is the measurement accuracy reference where zero discrepancy implies no difference between the acoustic analysis software package (AASP) measured value and the input value for the synthesized vowel. The gray region above and below the zero reference line reflects ±10% range of synthesis input value. Manually measured B1-B4 are displayed with a star symbol. Left panel displays discrepancy scores using Praat, and the right panel Wavesurfer
Figure 3
Figure 3
Discrepancy scores using Praat for the adult male and female (left panel) and child male and female (right panel) speaker’s fundamental (F0) and formant frequencies (F1-F4) for the four Hillenbrand vowels. The box plots display the mean, 25th percentile value, and 75th percentile value for F0 and F1-F4, in addition to the mode (solid line) and the median (dotted line). The zero or accuracy reference line represents the Hillenbrand et al (1995) reported values averaged across the five speakers analyzed, and the shaded region reflects ± 10% of the this averaged value.
Figure 4
Figure 4
Discrepancy scores using Wavesurfer for the adult male and female (left panel) and child male and female (right panel) speaker’s fundamental (F0) and formant frequencies (F1-F4) for the four Hillenbrand vowels. For additional information regarding box plot or shaded region, refer to Figure 3 caption.
Figure 5
Figure 5
Discrepancy scores using TF32 for the adult male and female (left panel) and child male and female (right panel) speaker’s fundamental (F0) and formant frequencies (F1-F4) for the four Hillenbrand vowels. For additional information regarding box plot or shaded region, refer to Figure 3 caption.
Figure 6
Figure 6
Discrepancy scores using CSL for the adult male and female (left panel) and child male and female (right panel) speaker’s fundamental (F0) and formant frequencies (F1-F4) for the four Hillenbrand vowels. For additional information regarding box plot or shaded region, refer to Figure 3 caption.
Figure 7
Figure 7
A. Discrepancy scores for the bandwidth of the four synthesized vowels, using Praat (left panel) and Wavesurfer (right panel). The zero or accuracy reference line refers to no difference between the manually measured value and the AASP measured value. The gray region above and below the zero reference line reflects ±10% range of manually measured bandwidth value. For additional information regarding box plot refer to Figure 2A caption. B. Discrepancy scores for the bandwidth of the four synthesized vowels, using TF32 (left panel) and CSL (right panel). For additional information refer to Figure 7A caption.
Figure 7
Figure 7
A. Discrepancy scores for the bandwidth of the four synthesized vowels, using Praat (left panel) and Wavesurfer (right panel). The zero or accuracy reference line refers to no difference between the manually measured value and the AASP measured value. The gray region above and below the zero reference line reflects ±10% range of manually measured bandwidth value. For additional information regarding box plot refer to Figure 2A caption. B. Discrepancy scores for the bandwidth of the four synthesized vowels, using TF32 (left panel) and CSL (right panel). For additional information refer to Figure 7A caption.

Similar articles

Cited by

References

    1. Baken RJ, Orlikoff RF. Clinical Measurement of Speech & Voice (Speech Science) 2 ed. San Diego: Singular; 1999.
    1. Bielamowicz S, Kreiman J, Gerratt BR, Dauer MS, Berke GS. Comparison of voice analysis systems for perturbation measurement. Journal of Speech and Hearing Research. 1996;39:126–134. - PubMed
    1. Boersma P, Weenink D. Praat (5.1.32) Amsterdam, The Netherlands: Publisher; 2010. Available from http://www.fon.hum.uva.nl/praat.
    1. Fant CG. Descriptive analysis of the acoustic aspects of speech. Logos. 1962;5:3–17. - PubMed
    1. Fourakis M, Preisel C, Hawks JW. Perception of vowel stimuli synthesized with different fundamental frequencies. Journal of the Acoustical Society of America. 1998;104:1778.

Publication types

LinkOut - more resources