

Fibre type-specific satellite cell response to aerobic training in sedentary adults
- PMID: 24687582
- PMCID: PMC4080942
- DOI: 10.1113/jphysiol.2014.271288
Fibre type-specific satellite cell response to aerobic training in sedentary adults
Abstract
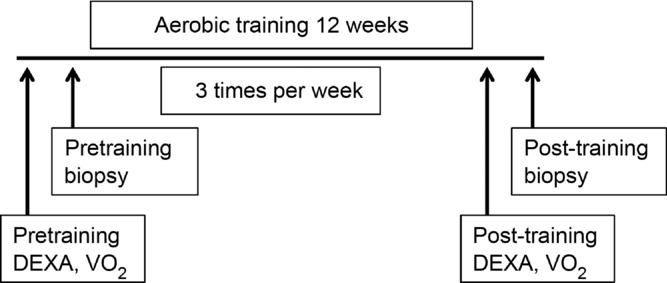
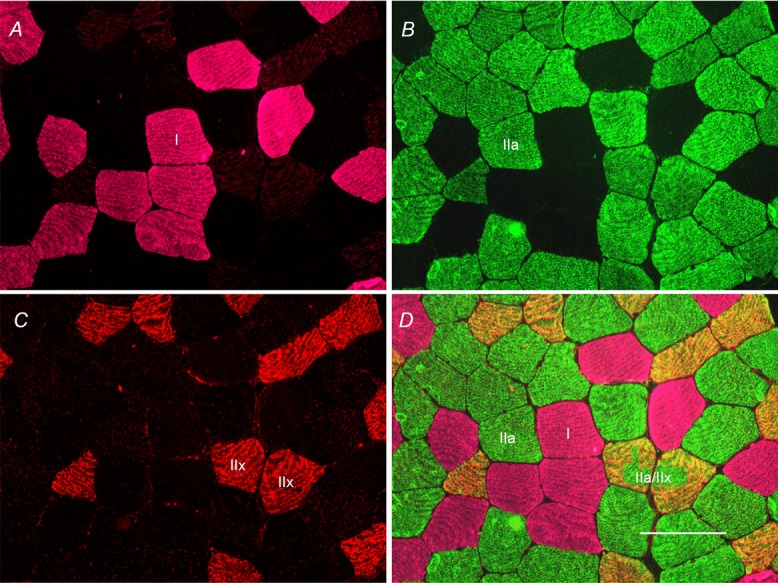
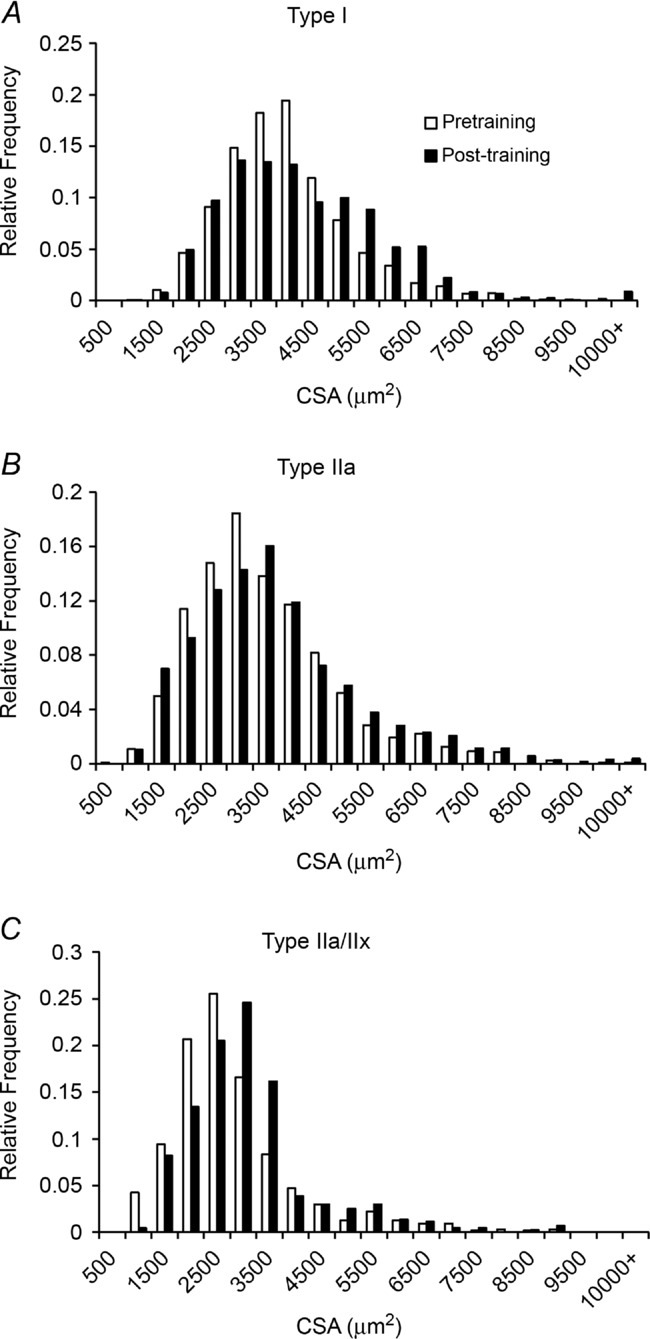
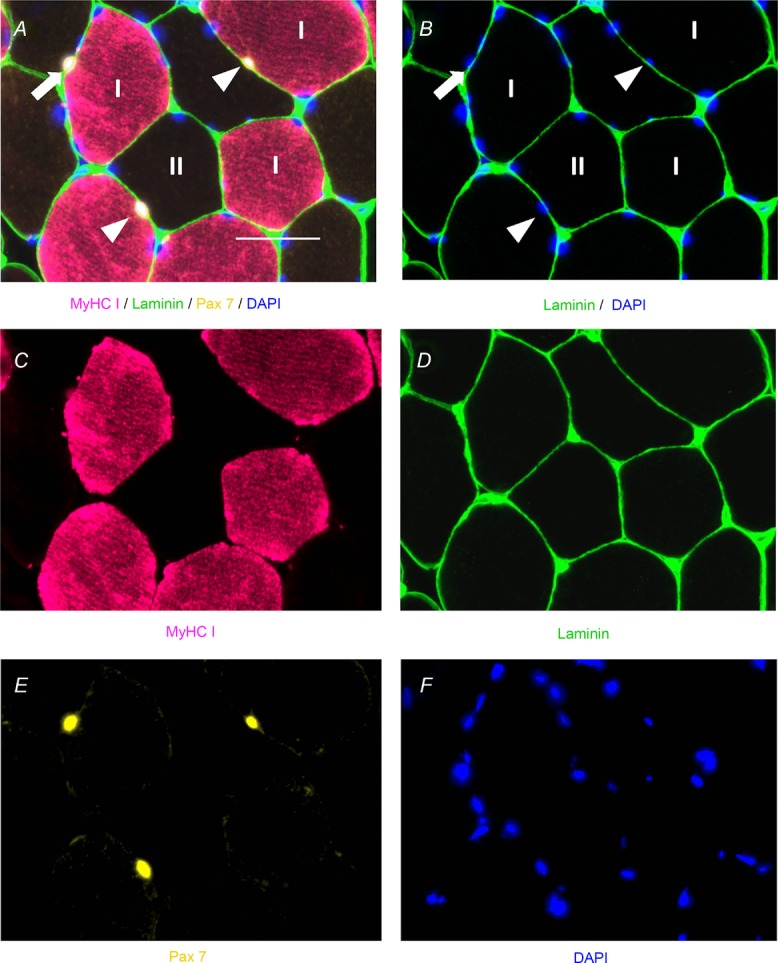
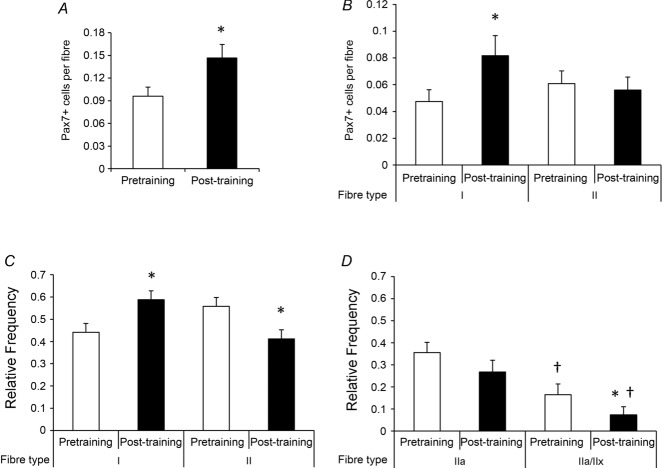
In the present study, we sought to determine the effect of a traditional, 12 week aerobic training protocol on skeletal muscle fibre type distribution and satellite cell content in sedentary subjects. Muscle biopsies were obtained from the vastus lateralis [n = 23 subjects (six male and 17 female); body mass index 30.7 ± 1.2 kg m(-2)] before and after 12 weeks of aerobic training performed on a cycle ergometer. Immunohistochemical analyses were used to quantify myosin heavy chain (MyHC) isoform expression, cross-sectional area and satellite cell and myonuclear content. Following training, a decrease in MyHC hybrid type IIa/IIx fibre frequency occurred, with a concomitant increase in pure MyHC type IIa fibres. Pretraining fibre type correlated with body mass index, and the change in fibre type following training was associated with improvements in maximal oxygen consumption. Twelve weeks of aerobic training also induced increases in mean cross-sectional area in both MyHC type I and type IIa fibres. Satellite cell content was also increased following training, specifically in MyHC type I fibres, with no change in the number of satellite cells associated with MyHC type II fibres. With the increased satellite cell content following training, an increase in myonuclear number per fibre also occurred in MyHC type I fibres. Hypertrophy of MyHC type II fibres occurred without detectable myonuclear addition, suggesting that the mechanisms underlying growth in fast and slow fibres differ. These data provide intriguing evidence for a fibre type-specific role of satellite cells in muscle adaptation following aerobic training.
© 2014 The Authors. The Journal of Physiology © 2014 The Physiological Society.
Figures
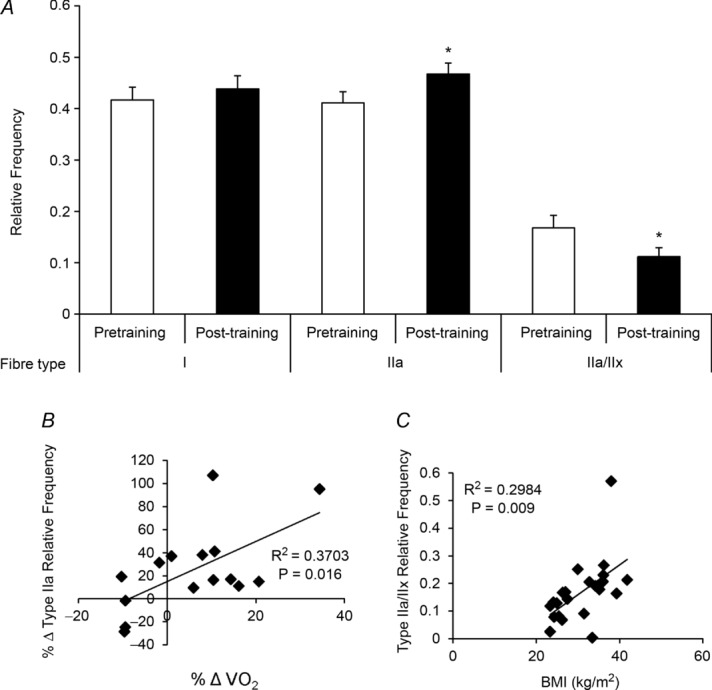
 ) following 12 weeks of aerobic training. C, correlation of pretraining MyHC hybrid IIa/IIx fibre frequency and body mass index (BMI). *Significantly different from pretraining value (P < 0.05).
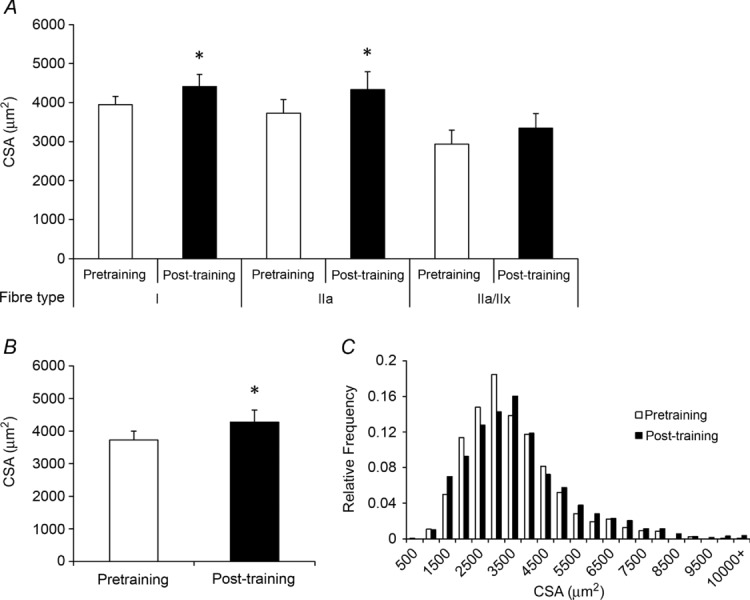

Comment in
-
Fibre type-specific hypertrophy mechanisms in human skeletal muscle: potential role of myonuclear addition.J Physiol. 2014 Dec 1;592(23):5147-8. doi: 10.1113/jphysiol.2014.282574. J Physiol. 2014. PMID: 25448185 Free PMC article. No abstract available.
Similar articles
-
Resistance exercise training promotes fiber type-specific myonuclear adaptations in older adults.J Appl Physiol (1985). 2020 Apr 1;128(4):795-804. doi: 10.1152/japplphysiol.00723.2019. Epub 2020 Mar 5. J Appl Physiol (1985). 2020. PMID: 32134710 Free PMC article.
-
The effect of resistance training, detraining and retraining on muscle strength and power, myofibre size, satellite cells and myonuclei in older men.Exp Gerontol. 2020 May;133:110860. doi: 10.1016/j.exger.2020.110860. Epub 2020 Feb 1. Exp Gerontol. 2020. PMID: 32017951
-
Abundant expression of myosin heavy-chain IIB RNA in a subset of human masseter muscle fibres.Arch Oral Biol. 2001 Nov;46(11):1039-50. doi: 10.1016/s0003-9969(01)00066-8. Arch Oral Biol. 2001. PMID: 11543711 Free PMC article.
-
Myopathies associated with myosin heavy chain mutations.Acta Myol. 2004 Sep;23(2):90-6. Acta Myol. 2004. PMID: 15605950 Review.
-
The myonuclear domain in adult skeletal muscle fibres: past, present and future.J Physiol. 2023 Feb;601(4):723-741. doi: 10.1113/JP283658. Epub 2023 Jan 30. J Physiol. 2023. PMID: 36629254 Free PMC article. Review.
Cited by
-
High Intensity Training May Reverse the Fiber Type Specific Decline in Myogenic Stem Cells in Multiple Sclerosis Patients.Front Physiol. 2016 May 31;7:193. doi: 10.3389/fphys.2016.00193. eCollection 2016. Front Physiol. 2016. PMID: 27303309 Free PMC article.
-
Effect of Blood Flow Restriction Training on Quadriceps Muscle Strength, Morphology, Physiology, and Knee Biomechanics Before and After Anterior Cruciate Ligament Reconstruction: Protocol for a Randomized Clinical Trial.Phys Ther. 2019 Aug 1;99(8):1010-1019. doi: 10.1093/ptj/pzz062. Phys Ther. 2019. PMID: 30951598 Free PMC article. Clinical Trial.
-
Myonuclear Domain Flexibility Challenges Rigid Assumptions on Satellite Cell Contribution to Skeletal Muscle Fiber Hypertrophy.Front Physiol. 2018 May 29;9:635. doi: 10.3389/fphys.2018.00635. eCollection 2018. Front Physiol. 2018. PMID: 29896117 Free PMC article.
-
Fibre type-specific hypertrophy mechanisms in human skeletal muscle: potential role of myonuclear addition.J Physiol. 2014 Dec 1;592(23):5147-8. doi: 10.1113/jphysiol.2014.282574. J Physiol. 2014. PMID: 25448185 Free PMC article. No abstract available.
-
Exercise Promotes Tissue Regeneration: Mechanisms Involved and Therapeutic Scope.Sports Med Open. 2023 May 6;9(1):27. doi: 10.1186/s40798-023-00573-9. Sports Med Open. 2023. PMID: 37149504 Free PMC article. Review.
References
-
- Adams GR, Caiozzo VJ, Haddad F, Baldwin KM. Cellular and molecular responses to increased skeletal muscle loading after irradiation. Am J Physiol Cell Physiol. 2002;283:C1182–C1195. - PubMed
-
- Amthor H, Otto A, Vulin A, Rochat A, Dumonceaux J, Garcia L, Mouisel E, Hourdé C, Macharia R, Friedrichs M, Relaix F, Zammit PS, Matsakas A, Patel K, Partridge T. Muscle hypertrophy driven by myostatin blockade does not require stem/precursor-cell activity. Proc Natl Acad Sci U S A. 2009;106:7479–7484. - PMC - PubMed
-
- Blaauw B, Canato M, Agatea L, Toniolo L, Mammucari C, Masiero E, Abraham R, Sandri M, Schiaffino S, Reggiani C. Inducible activation of Akt increases skeletal muscle mass and force without satellite cell activation. FASEB J. 2009;23:3896–3905. - PubMed
-
- Charifi N, Kadi F, Feasson L, Denis C. Effects of endurance training on satellite cell frequency in skeletal muscle of old men. Muscle Nerve. 2003;28:87–92. - PubMed
-
- Dupont-Versteegden EE, Murphy RJL, Houle JD, Gurley CM, Peterson CA. Mechanisms leading to restoration of muscle size with exercise and transplantation after spinal cord injury. Am J Physiol Cell Physiol. 2000;279:C1677–C1684. - PubMed
Publication types
MeSH terms
Substances
Grants and funding
LinkOut - more resources
Full Text Sources
Other Literature Sources
Medical