. 2014 Apr 7;211(4):715-25.
doi: 10.1084/jem.20130590. Epub 2014 Mar 31.

Engagement of the ICOS pathway markedly enhances efficacy of CTLA-4 blockade in cancer immunotherapy

Affiliations

Engagement of the ICOS pathway markedly enhances efficacy of CTLA-4 blockade in cancer immunotherapy

Xiaozhou Fan et al. J Exp Med. .

Abstract

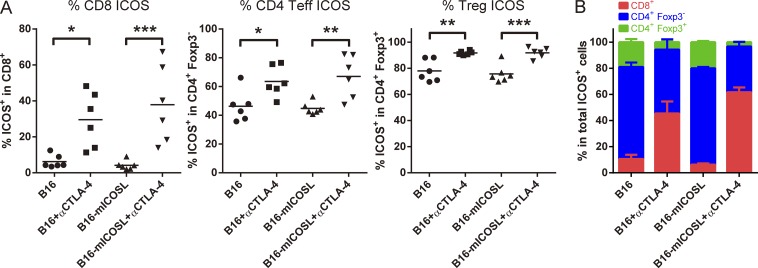
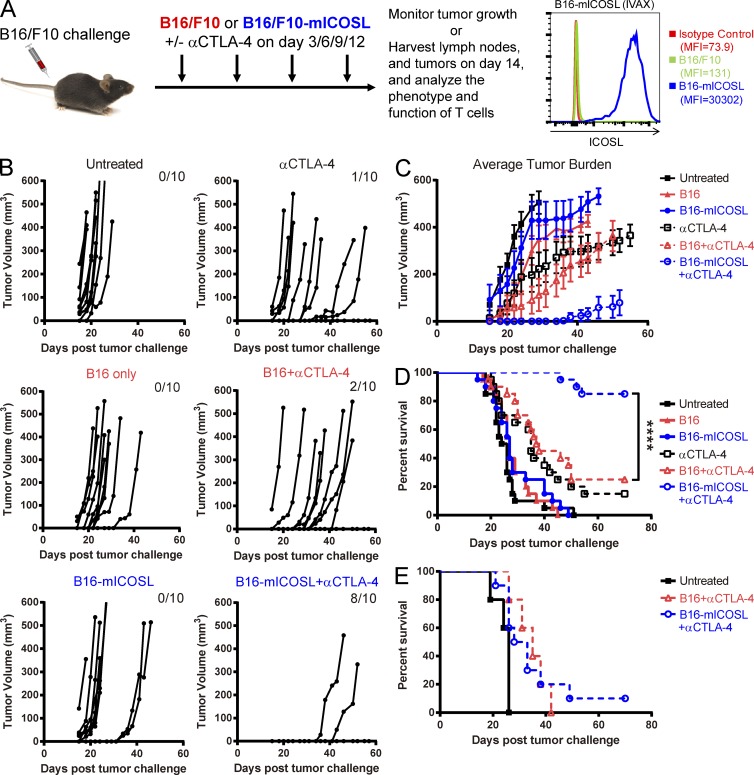
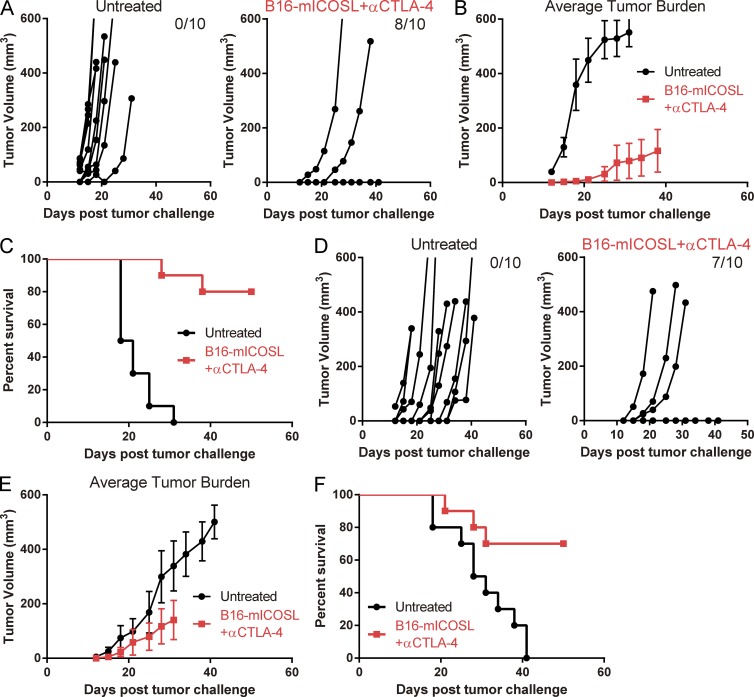
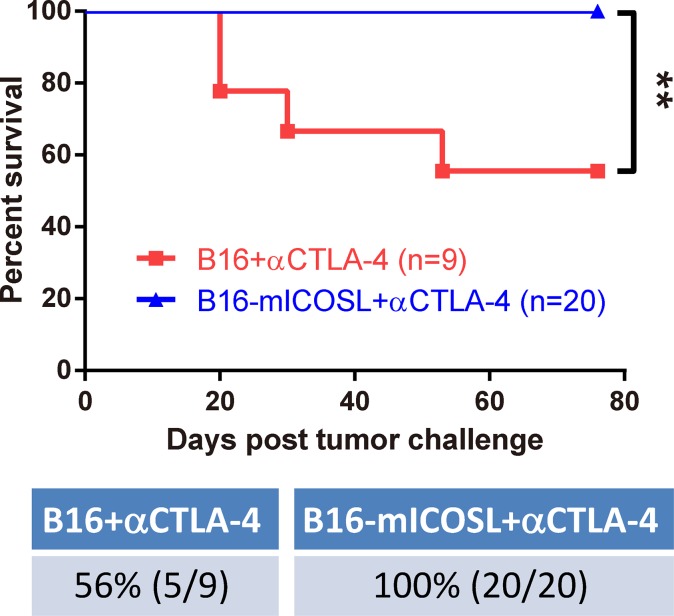
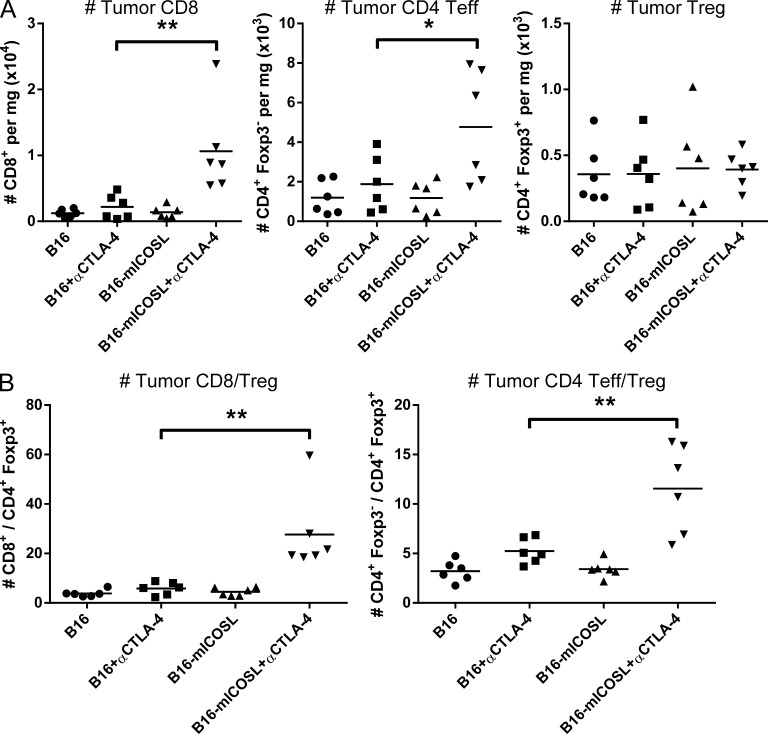
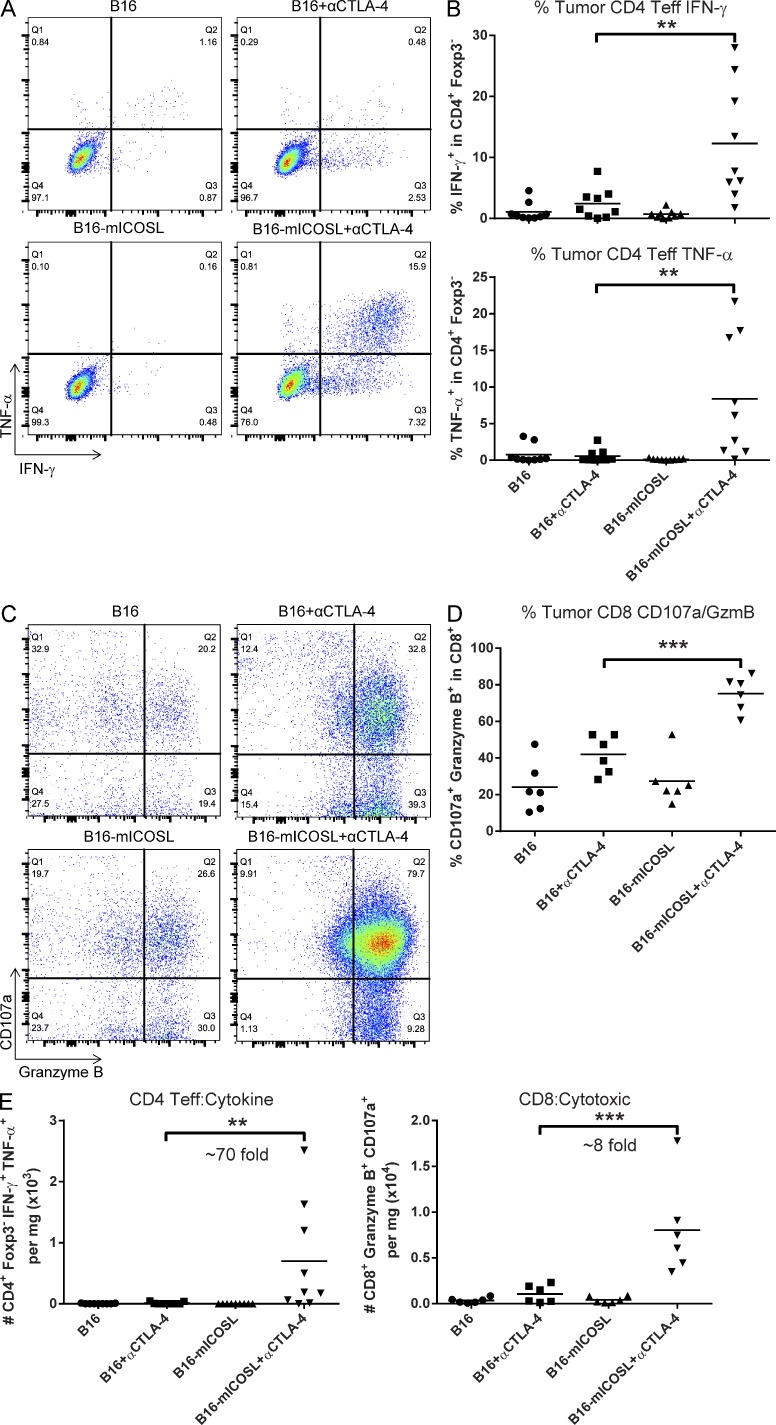
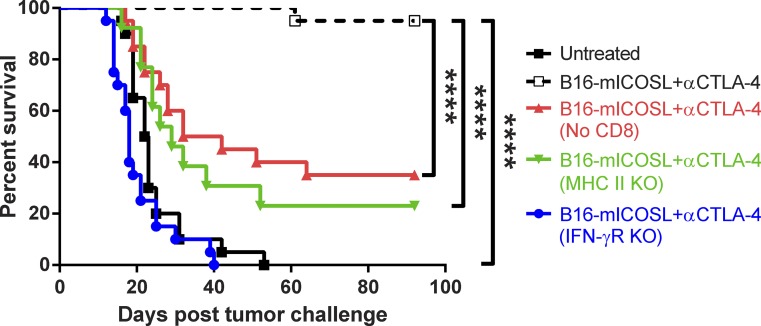
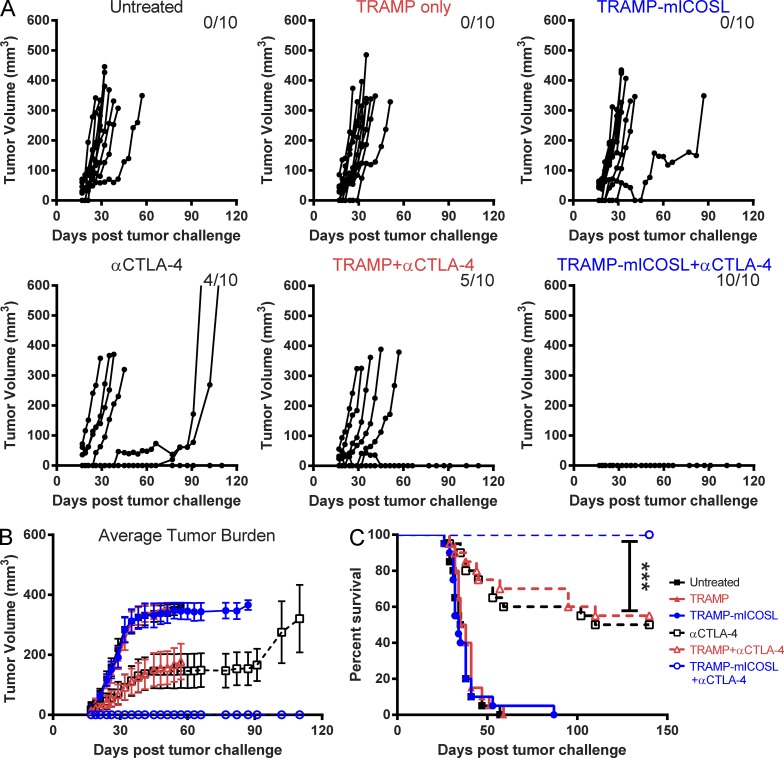
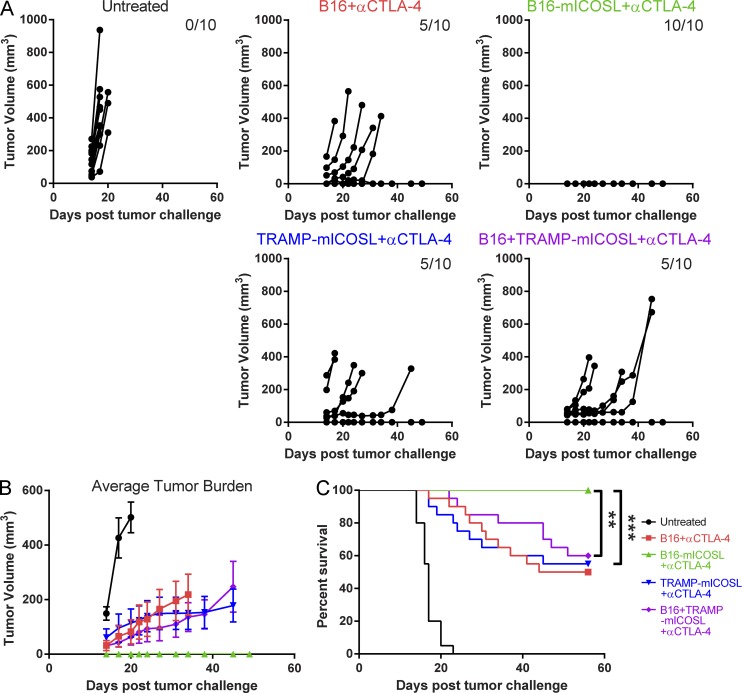
Cytotoxic T lymphocyte antigen-4 (CTLA-4) blockade with a monoclonal antibody yields durable responses in a subset of cancer patients and has been approved by the FDA as a standard therapy for late-stage melanoma. We recently identified inducible co-stimulator (ICOS) as a crucial player in the antitumor effects of CTLA-4 blockade. We now show that concomitant CTLA-4 blockade and ICOS engagement by tumor cell vaccines engineered to express ICOS ligand enhanced antitumor immune responses in both quantity and quality and significantly improved rejection of established melanoma and prostate cancer in mice. This study provides strong support for the development of combinatorial therapies incorporating anti-CTLA-4 and ICOS engagement.


Figures

Figure 1.
Figure 1.
Treatment of B16/F10 tumors with anti–CTLA-4 led to increased frequency of ICOS expression on tumor-infiltrating CD8 and CD4 Teff cells. (A) Frequency of ICOS expression on CD8, CD4 Foxp3, and CD4 Foxp3+ T cells in the tumor. Horizontal bars represent means. (B) Breakdown of total intratumoral ICOS+ T cells in terms of CD8, CD4 Foxp3, and CD4 Foxp3+ subsets. Data are pooled from two independent experiments (n = 3 mice per group). Error bars represent means ± SEM. Data were analyzed with one-way ANOVA and Bonferroni’s multiple comparisons test. *, P < 0.05; **, P < 0.01; ***, P < 0.001.
Figure 2.
Figure 2.
Cellular vaccine with ICOSL-expressing tumor cells (IVAX) synergized with CTLA-4 blockade to provide protection against B16/F10 tumors. (A) Treatment schedule of vaccination and CTLA-4 blockade and the verification of ICOSL expression on IVAX. Expression of ICOS on B16 and IVAX were followed in vivo up to day 14 after tumor challenge. (B) Individual tumor growth curves after B16/F10 challenge. Numbers on the top right side represent tumor-free mice. Data are representative of three independent experiments (n = 10 mice per group). (C) Tumor growth curves depict average tumor volume in each group. Error bars represent means ± SEM. Data are representative of three independent experiments (n = 10 mice per group). (D) Cumulative survival curves from two independent experiments (n = 10 mice per group). Survival curves were analyzed with Log-rank test. ****, P < 0.0001. (E) Cumulative survival curves of ICOS-deficient hosts from two independent experiments (n = 5 mice per group).
Figure 3.
Figure 3.
Combination of IVAX and CTLA-4 blockade led to rejection of higher doses of injected tumor cells and increased eradication of established tumors. (A–F) Mice were challenged with 100K B16/F10 cells and treated from day 3 (A–C) or challenged with 50K B16/F10 but treated from day 6 (D–F). (A) Individual tumor growth curves after challenge with 100K B16/F10 cells. (B) Tumor growth curves depict average tumor volume in each group. (C) Overall survival curves representative of two independent experiments (n = 10 mice per group). (D) Individual tumor growth curves after challenge with 50K B16/F10 cells. (A and D) Numbers on the top right side represent tumor-free mice. Data are representative of two independent experiments (n = 10 mice per group). (E) Tumor growth curves depict average tumor volume in each group. (B and E) Error bars represent means ± SEM. Data are representative of two independent experiments (n = 10 mice per group). (F) Overall survival curves representative of two independent experiments (n = 10 mice per group).
Figure 4.
Figure 4.
Stimulation of the ICOS pathway also improved memory response against B16/F10 rechallenge. Mice that had been treated with the indicated combination therapies and survived the primary B16/F10 tumor were rechallenged with 200K B16/F10 cells but with no further treatment. Data are representative of two independent experiments. Survival curves were analyzed with Log-rank test. **, P < 0.01.
Figure 5.
Figure 5.
Combination of IVAX and CTLA-4 blockade enriched CD8 and CD4 Foxp3 T cells in the tumor and raised the intratumoral CD8/Treg and CD4 Teff/Treg cell ratios. (A) Density of CD8, CD4 Foxp3, and CD4 Foxp3+ T cells depicted as absolute number of cells per milligram of tumor on day 14 after tumor challenge. Numbers of T cells in tumors were calculated as described in Materials and methods. Data are pooled from two independent experiments (n = 3 mice per group). (B) Cumulative quantification of CD8/Treg and CD4 Teff/Treg cell ratios in day 14 B16/F10 tumors from two independent experiments (n = 3 mice per group). Horizontal bars represent means. Data were analyzed with one-way ANOVA and Bonferroni’s multiple comparisons test. *, P < 0.05; **, P < 0.01.
Figure 6.
Figure 6.
Combination of IVAX and CTLA-4 blockade enhanced proinflammatory cytokine production by CD4 Foxp3 T cells and cytotoxicity of CD8 T cells. (A) Dot plots of IFN-γ and TNF staining in tumor-infiltrating CD4 Foxp3 T cells. Numbers in the quadrants are relative frequency. Data are representative of three independent experiments (n = 3 mice per group). (B) Cumulative quantification of the frequency of IFN-γ and TNF production in tumor-infiltrating CD4 Foxp3 T cells from three independent experiments (n = 3 mice per group). (C) Dot plots of granzyme B and CD107a staining in tumor-infiltrating CD8 T cells. Numbers in the quadrants are relative frequency. Data are representative of two independent experiments (n = 3 mice per group). (D) Cumulative quantification of the frequency of granzyme B+ CD107a+ in tumor-infiltrating CD8 T cells from two independent experiments (n = 3 mice per group). (E) Density of IFN-γ+ TNF+ CD4 Foxp3 T cells (left) and granzyme B+ CD107a+ CD8 T cells (right) depicted as absolute numbers of these cells per milligram of tumor. Numbers of T cells in tumors were calculated as described in Materials and methods. Data are pooled from two or three independent experiments (n = 3 mice per group). Horizontal bars represent means. Data were analyzed with one-way ANOVA and Bonferroni’s multiple comparisons test. **, P < 0.01; ***, P < 0.001.
Figure 7.
Figure 7.
CD8, CD4 T cells, and IFN-γ were indispensable for therapeutic efficacy. B16/F10 tumor-bearing mice were treated with IVAX and CTLA-4 blockade as described in Fig. 2 A and were depleted of CD8 cells with anti-CD8 (clone 2.43; n = 20). The tumor protection rate was also measured in MHC class II KO (n = 13) or IFN-γR KO (n = 20) hosts. Data were pooled from two independent experiments. Survival curves were analyzed with Log-rank test. ****, P < 0.0001.
Figure 8.
Figure 8.
Combination therapy of IVAX and CTLA-4 blockade was also therapeutic against mouse prostate tumors. (A) Individual tumor growth curves after challenge with TRAMP C2 cells. Numbers on the top right side represent tumor-free mice. Data are representative of two independent experiments (n = 10 mice per group). (B) Tumor growth curves depict average tumor volume in each group. Error bars represent means ± SEM. Data are representative of two independent experiments (n = 10 mice per group). (C) Cumulative survival curves from two independent experiments (n = 10 mice per group). Survival curves were analyzed with Log-rank test. ***, P < 0.001.
Figure 9.
Figure 9.
Tumor protection by IVAX requires presentation in cis. B16/F10 tumor-bearing mice were treated with TRAMP-based IVAX or a 1:1 mixture of irradiated wild-type ICOSL-negative B16 and TRAMP-based IVAX. Irradiated wild-type B16 and B16-based IVAX were included as control. CTLA-4 blockade was given in all the treatment groups. (A) Individual tumor growth curves after B16/F10 challenge. Numbers on the top right side represent tumor-free mice. Data are representative of two independent experiments (n = 10 mice per group). (B) Tumor growth curves depict average tumor volume in each group. Error bars represent means ± SEM. Data are representative of two independent experiments (n = 10 mice per group). (C) Cumulative survival curves from two independent experiments (n = 10 mice per group). Survival curves were analyzed with Log-rank test. **, P < 0.01; ***, P < 0.001.

References

    1. Ara G., Baher A., Storm N., Horan T., Baikalov C., Brisan E., Camacho R., Moore A., Goldman H., Kohno T., et al. 2003. Potent activity of soluble B7RP-1-Fc in therapy of murine tumors in syngeneic hosts. Int. J. Cancer. 103:501–507 10.1002/ijc.10831 - DOI - PubMed
    1. Carthon B.C., Wolchok J.D., Yuan J., Kamat A., Ng Tang D.S., Sun J., Ku G., Troncoso P., Logothetis C.J., Allison J.P., Sharma P. 2010. Preoperative CTLA-4 blockade: Tolerability and immune monitoring in the setting of a presurgical clinical trial. Clin. Cancer Res. 16:2861–2871 10.1158/1078-0432.CCR-10-0569 - DOI - PMC - PubMed
    1. Curran M.A., Allison J.P. 2009. Tumor vaccines expressing flt3 ligand synergize with ctla-4 blockade to reject preimplanted tumors. Cancer Res. 69:7747–7755 10.1158/0008-5472.CAN-08-3289 - DOI - PMC - PubMed
    1. Foster B.A., Gingrich J.R., Kwon E.D., Madias C., Greenberg N.M. 1997. Characterization of prostatic epithelial cell lines derived from transgenic adenocarcinoma of the mouse prostate (TRAMP) model. Cancer Res. 57:3325–3330 - PubMed
    1. Fu T., He Q., Sharma P. 2011. The ICOS/ICOSL pathway is required for optimal antitumor responses mediated by anti–CTLA-4 therapy. Cancer Res. 71:5445–5454 10.1158/0008-5472.CAN-11-1138 - DOI - PubMed

Publication types

MeSH terms