. 2014 Oct 1;210(7):1100-9.
doi: 10.1093/infdis/jiu203. Epub 2014 Mar 31.

Hemoglobinopathic erythrocytes affect the intraerythrocytic multiplication of Plasmodium falciparum in vitro

Affiliations

Hemoglobinopathic erythrocytes affect the intraerythrocytic multiplication of Plasmodium falciparum in vitro

Svetlana Glushakova et al. J Infect Dis. .

Abstract

Background: The mechanisms by which α-thalassemia and sickle cell traits confer protection from severe Plasmodium falciparum malaria are not yet fully elucidated. We hypothesized that hemoglobinopathic erythrocytes reduce the intraerythrocytic multiplication of P. falciparum, potentially delaying the development of life-threatening parasite densities until parasite clearing immunity is achieved.

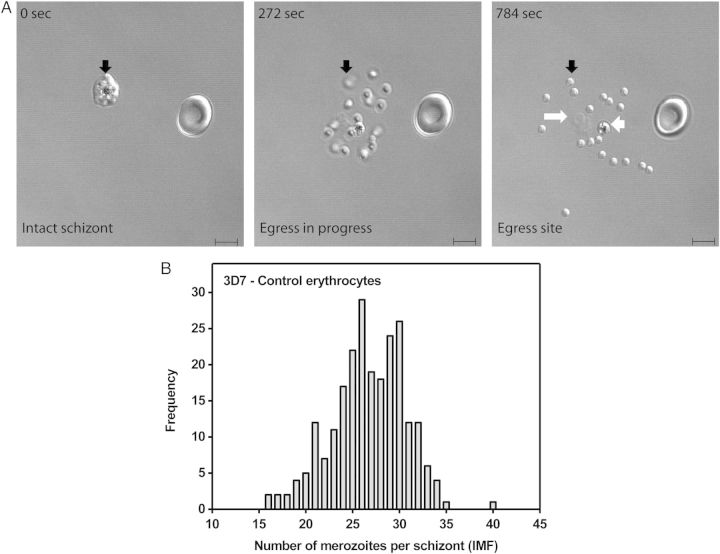
Methods: We developed a novel in vitro assay to quantify the number of merozoites released from an individual schizont, termed the "intraerythrocytic multiplication factor" (IMF).

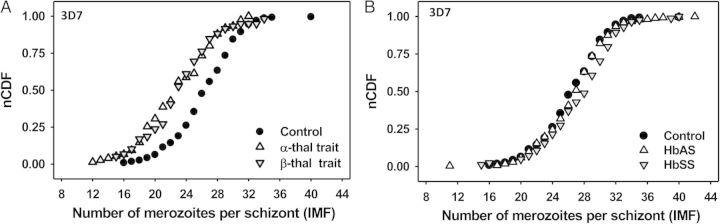
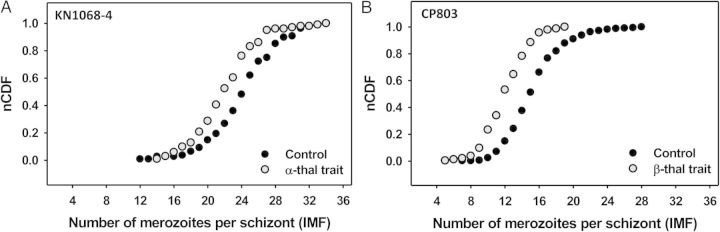
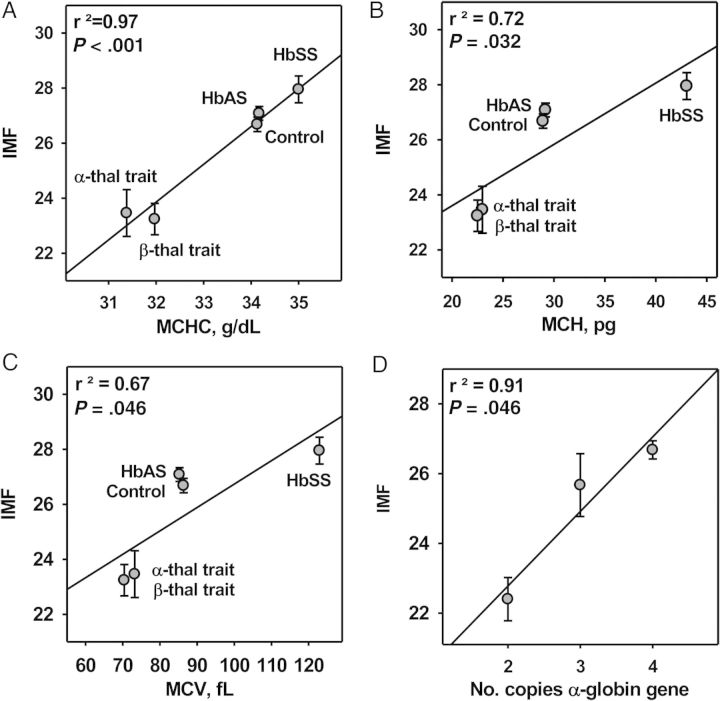
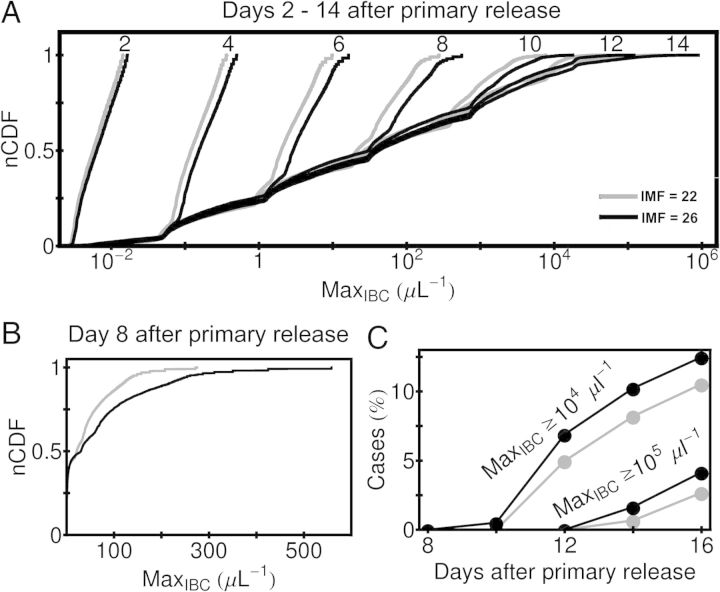
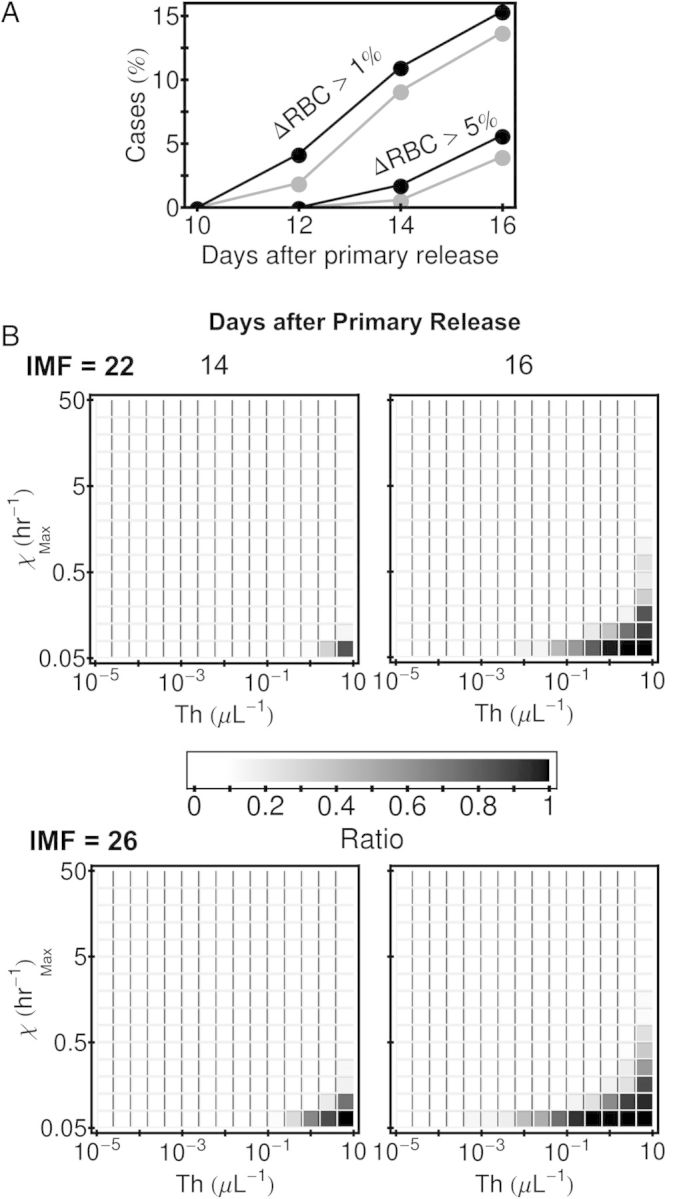
Results: P. falciparum (3D7 line) schizonts produce variable numbers of merozoites in all erythrocyte types tested, with median IMFs of 27, 27, 29, 23, and 23 in control, HbAS, HbSS, and α- and β-thalassemia trait erythrocytes, respectively. IMF correlated strongly (r(2) = 0.97; P < .001) with mean corpuscular hemoglobin concentration, and varied significantly with mean corpuscular volume and hemoglobin content. Reduction of IMFs in thalassemia trait erythrocytes was confirmed using clinical parasite isolates with different IMFs. Mathematical modeling of the effect of IMF on malaria progression indicates that the lower IMF in thalassemia trait erythrocytes limits parasite density and anemia severity over the first 2 weeks of parasite replication.

Conclusions: P. falciparum IMF, a parasite heritable virulence trait, correlates with erythrocyte indices and is reduced in thalassemia trait erythrocytes. Parasite IMF should be examined in other low-indices erythrocytes.

Keywords: Plasmodium falciparum; hemoglobinopathy; malaria; sickle hemoglobin; thalassemia.


Figures

Figure 1.
Figure 1.
P. falciparum 3D7 schizonts produce variable numbers of merozoites in control erythrocytes. A, Formation of a merozoite egress site by a 3D7 schizont infected control erythrocyte. Selected frames from a time-lapse recording of the egress process are shown. The 0-second frame shows an uninfected erythrocyte and an intact segmenting schizont (black arrow) containing multiple merozoites, which cannot be accurately counted. The 272-second frame shows merozoites in motion shortly after egress. Those that have not yet settled onto the glass surface are out of focus (black arrow). The 784-second frame shows a fully formed egress site littered with a single food vacuole (short white arrow) containing hemozoin, erythrocyte membrane fragments (long white arrow), and 18 merozoites (short black arrow), which have scattered and settled onto the glass surface. The “intraerythrocytic multiplication factor” (IMF) of this particular schizont is 18. DIC microscopy, scale bar = 5 µm. B, Non-Gaussian frequency distribution of 3D7 IMFs for 237 singly infected control erythrocytes. Data are derived from 17 independent experiments using erythrocytes from 13 healthy donors.
Figure 2.
Figure 2.
Hemoglobin type affects the intraerythrocytic multiplication factor (IMF) of the P. falciparum 3D7 line. Normalized cumulative distribution function (nCDF) plots of IMF values for 3D7 in normal (control) and hemoglobinopathic (α-thalassemia trait, β-thalassemia trait, HbAS, and HbSS) erythrocytes are shown. Lower and higher IMFs shift the curve to the left and right, respectively. Median IMFs of schizont populations correspond to nCDF values = 0.50. A, Distributions show that 3D7 schizonts produce fewer merozoites in both α- and β-thalassemia trait erythrocytes than in control erythrocytes. B, Distributions show that 3D7 schizonts produce more merozoites in both HbAS and HbSS erythrocytes than in control erythrocytes. Abbreviations: HbAS, hemoglobin A and S heterozygosity (individuals with sickle cell trait); HbSS, hemoglobin S homozygosity (individuals with sickle cell disease); thal, thalassemia.
Figure 3.
Figure 3.
Hemoglobin type affects the intraerythrocytic multiplication factor (IMF) of clinical P. falciparum isolates. Normalized cumulative distribution function (nCDF) plots of IMF values for 2 clinical parasite isolates in normal (control) and hemoglobinopathic (α- and β-thalassemia trait) erythrocytes are shown. Lower and higher IMFs shift the curve to the left and right, respectively. Median IMFs of schizont populations correspond to nCDF values = 0.50. A, Distributions show that the parasite isolate KN1068-4 from Mali produces fewer merozoites per schizont in α-thalassemia trait erythrocytes. B, Distributions show that the parasite isolate CP803 from Cambodia produces fewer merozoites per schizont in β-thalassemia trait erythrocytes. Note that the mean IMF of CP803 is significantly lower than the mean IMFs of KN1068-4 and the P. falciparum 3D7 line. Abbreviation: thal, thalassemia.
Figure 4.
Figure 4.
The intraerythrocytic multiplication factor (IMF) correlates strongly with erythrocyte indices. A, Linear regression analysis showing a strong positive correlation between mean IMFs for the P. falciparum 3D7 line and mean MCHCs of control and hemoglobinopathic erythrocytes. B, Linear regression analysis showing a positive correlation between mean IMFs for the P. falciparum 3D7 line and mean MCHs of control and hemoglobinopathic erythrocytes. C, Linear regression analysis showing a positive correlation between mean IMFs for the P. falciparum 3D7 line and mean MCVs of control and hemoglobinopathic erythrocytes. D, Linear regression analysis showing a strong correlation between mean IMFs for the P. falciparum 3D7 line and the number of functional α-globin genes in normal and α-thalassemia trait erythrocytes. Abbreviations: HbAS, hemoglobin A and S heterozygosity (individuals with sickle cell trait); HbSS, hemoglobin S homozygosity (individuals with sickle cell disease); MCH, mean corpuscular hemoglobin; MCHC, mean corpuscular hemoglobin concentration; MCV, mean corpuscular volume; thal, thalassemia.
Figure 5.
Figure 5.
Predicted effect of intraerythrocytic multiplication factor (IMF) on parasite density in early simulated infections. A, Normalized cumulative distribution function (nCDF) plots of the maximum infected RBC (MaxIBC) observed for simulations up to 14 days after the beginning of asexual parasite replication (ie, after primary release from the liver). Simulated infections with IMF = 22 and IMF = 26 parasites are compared. Note that MaxIBC is plotted on a logarithmic scale. B, The cumulative distribution for MaxIBC at day 8 after primary release, with MaxIBC plotted on a linear scale. C, The fraction of simulations for which MaxIBC exceeds 104/µL and 105/µL at 8, 10, 12, 14, and 16 days after primary release. The same gray-scale code for IMF is used for all panels. Abbreviation: RBC, red blood cell.
Figure 6.
Figure 6.
Predicted effect of intraerythrocytic multiplication factor (IMF) on the degree of anemia in early simulated infections. A, The fraction of simulations for which ΔRBC (the difference between basal RBC count, 5 × 10⁶/µL, prior to infection and the RBC count during infection) exceeds 5 × 10⁴/µL (1% of the basal RBC count) and 2.5 × 10⁵/µL (5% of the basal RBC count) at 10, 12, 14, and 16 days after the beginning of asexual parasite replication (ie, after primary release from the liver). The gray-scale code for IMF is used here as in Figure 5A. B, The fraction of simulations for which ΔRBC exceeds 2.5 × 10⁵/μL in different parts of the parameter space of the model immune response at 14 and 16 days after primary release. The 10 000 simulations done for each IMF are binned by their values of threshold density of merozoites that triggers the response, Th, and maximum killing rate of infected RBCs, χMax. The horizontal extent of the blocks shows the bin size Th, and the vertical extent shows the bin size χMax. Note that 2.5 × 10⁴/µL is 5% of the basal RBC count. Abbreviation: RBC, red blood cell.

References

    1. Haldane JB. The rate of mutation of human genes. Hereditas. 1949;35:267–73.
    1. Taylor SM, Parobek CM, Fairhurst RM. Haemoglobinopathies and the clinical epidemiology of malaria: a systematic review and meta-analysis. Lancet Infect Dis. 2012;12:457–68. - PMC - PubMed
    1. Bunn HF. The triumph of good over evil: protection by the sickle gene against malaria. Blood. 2013;121:20–5. - PubMed
    1. Taylor SM, Cerami C, Fairhurst RM. Hemoglobinopathies: slicing the Gordian knot of Plasmodium falciparum malaria pathogenesis. PLOS Pathog. 2013;9:e1003327. - PMC - PubMed
    1. Cholera R, et al. Impaired cytoadherence of Plasmodium falciparum–infected erythrocytes containing sickle hemoglobin. Proc Natl Acad Sci USA. 2008;105:991–6. - PMC - PubMed

Publication types