

Atherosclerosis and atheroma plaque rupture: imaging modalities in the visualization of vasa vasorum and atherosclerotic plaques
- PMID: 24688380
- PMCID: PMC3944209
- DOI: 10.1155/2014/312764
Atherosclerosis and atheroma plaque rupture: imaging modalities in the visualization of vasa vasorum and atherosclerotic plaques
Abstract
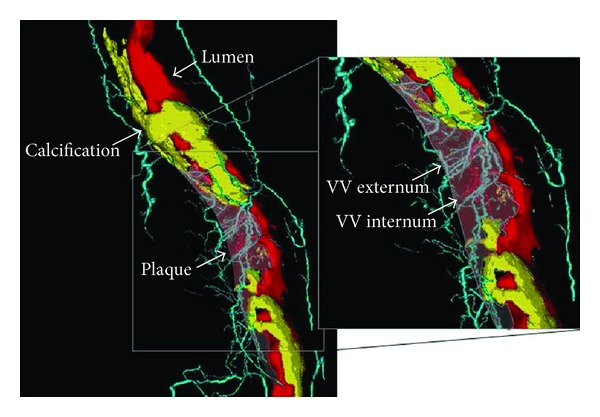
Invasive angiography has been widely accepted as the gold standard to diagnose cardiovascular pathologies. Despite its superior resolution of demonstrating atherosclerotic plaque in terms of degree of lumen stenosis, the morphological assessment for the plaque is insufficient for the analysis of plaque components, and therefore, unable to predict the risk status or vulnerability of atherosclerotic plaque. There is an increased body of evidence to show that the vasa vasorum play an important role in the initiation, progression, and complications of atherosclerotic plaque leading to major adverse cardiac events. This paper provides an overview of the evidence-based reviews of various imaging modalities with regard to their potential value for comprehensive characterization of the composition, burden, and neovascularization of atherosclerotic plaque.
Figures
Similar articles
-
Role of lipids and intraplaque hypoxia in the formation of neovascularization in atherosclerosis.Ann Med. 2017 Dec;49(8):661-677. doi: 10.1080/07853890.2017.1366041. Epub 2017 Aug 22. Ann Med. 2017. PMID: 28797175 Review.
-
Non-invasive imaging techniques and assessment of carotid vasa vasorum neovascularization: Promises and pitfalls.Trends Cardiovasc Med. 2019 Feb;29(2):71-80. doi: 10.1016/j.tcm.2018.06.007. Epub 2018 Jun 21. Trends Cardiovasc Med. 2019. PMID: 29970286 Review.
-
Quantification of plaque neovascularization using contrast ultrasound: a histologic validation.Eur Heart J. 2011 Mar;32(5):646-53. doi: 10.1093/eurheartj/ehq197. Epub 2010 Jun 24. Eur Heart J. 2011. PMID: 20581005 Free PMC article.
-
Noninvasive Coronary Plaque Imaging.J Atheroscler Thromb. 2018 Apr 1;25(4):281-293. doi: 10.5551/jat.RV17019. Epub 2017 Dec 9. J Atheroscler Thromb. 2018. PMID: 29225326 Free PMC article. Review.
-
Vasa vasorum imaging: a new window to the clinical detection of vulnerable atherosclerotic plaques.Curr Atheroscler Rep. 2005 Mar;7(2):164-9. doi: 10.1007/s11883-005-0040-2. Curr Atheroscler Rep. 2005. PMID: 15727733
Cited by
-
Vasa vasorum in atherosclerosis and clinical significance.Int J Mol Sci. 2015 May 20;16(5):11574-608. doi: 10.3390/ijms160511574. Int J Mol Sci. 2015. PMID: 26006236 Free PMC article. Review.
-
Coronary CT angiography in the quantitative assessment of coronary plaques.Biomed Res Int. 2014;2014:346380. doi: 10.1155/2014/346380. Epub 2014 Aug 5. Biomed Res Int. 2014. PMID: 25162010 Free PMC article. Review.
-
Early Assessment of Atherosclerotic Lesions and Vulnerable Plaques in vivo by Targeting Apoptotic Macrophages with AV Nanobubbles.Int J Nanomedicine. 2022 Oct 19;17:4933-4946. doi: 10.2147/IJN.S382738. eCollection 2022. Int J Nanomedicine. 2022. PMID: 36275481 Free PMC article.
-
Ginsenoside Rb1 Enhances Plaque Stability and Inhibits Adventitial Vasa Vasorum via the Modulation of miR-33 and PEDF.Front Cardiovasc Med. 2021 May 28;8:654670. doi: 10.3389/fcvm.2021.654670. eCollection 2021. Front Cardiovasc Med. 2021. PMID: 34124194 Free PMC article.
-
Long noncoding RNA TCONS_00024652 regulates vascular endothelial cell proliferation and angiogenesis via microRNA-21.Exp Ther Med. 2018 Oct;16(4):3309-3316. doi: 10.3892/etm.2018.6594. Epub 2018 Aug 10. Exp Ther Med. 2018. PMID: 30233677 Free PMC article.
References
-
- Ross R. Atherosclerosis—an inflammatory disease. The New England Journal of Medicine. 1999;340(2):115–126. - PubMed
-
- Gössl M, Malyar NM, Rosol M, Beighley PE, Ritman EL. Impact of coronary vasa vasorum functional structure on coronary vessel wall perfusion distribution. American Journal of Physiology. 2003;285(5):H2019–H2026. - PubMed
-
- Gössl M, Rosol M, Malyar NM, et al. Functional anatomy and hemodynamic characteristics of vasa vasorum in the walls of porcine coronary arteries. Anatomical Record A. 2003;272(2):526–537. - PubMed
-
- Gössl M, Zamir M, Ritman EL. Vasa vasorum growth in the coronary arteries of newborn pigs. Anatomy and Embryology. 2004;208(5):351–357. - PubMed
-
- Granada JF, Feinstein SB. Imaging of the vasa vasorum. Nature Clinical Practice Cardiovascular Medicine. 2008;5(2):S18–S25. - PubMed
Publication types
MeSH terms
LinkOut - more resources
Full Text Sources
Other Literature Sources
Medical
