

Botulinum toxin suppression of CNS network activity in vitro
- PMID: 24688538
- PMCID: PMC3944787
- DOI: 10.1155/2014/732913
Botulinum toxin suppression of CNS network activity in vitro
Abstract
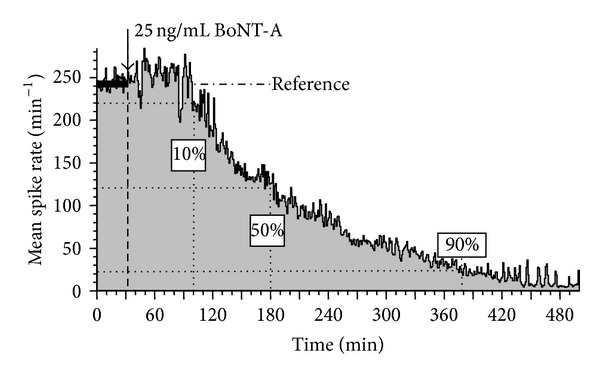
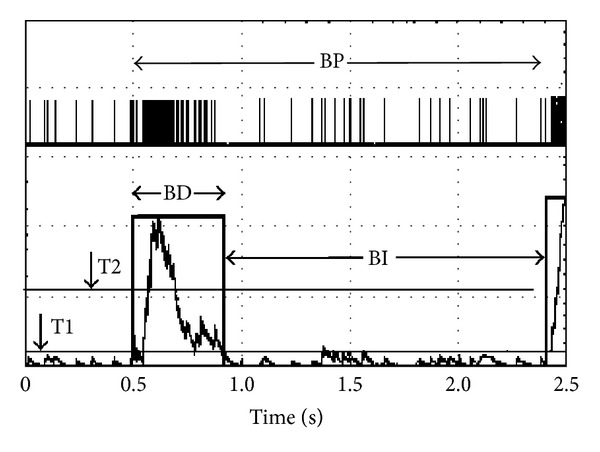
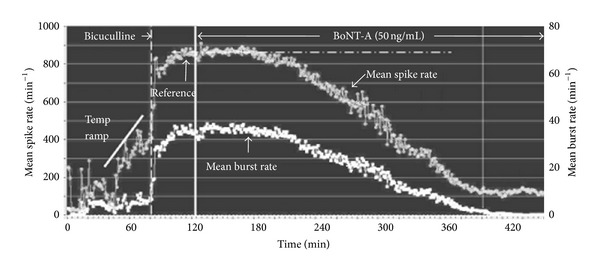
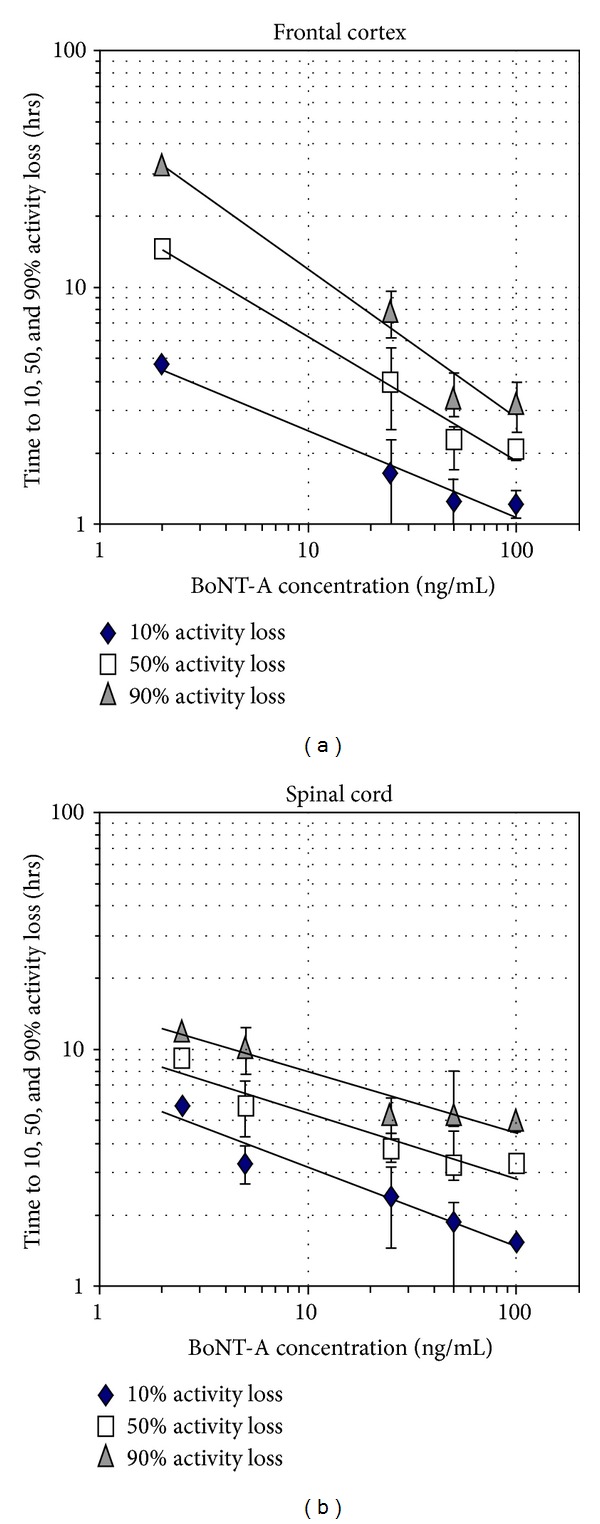
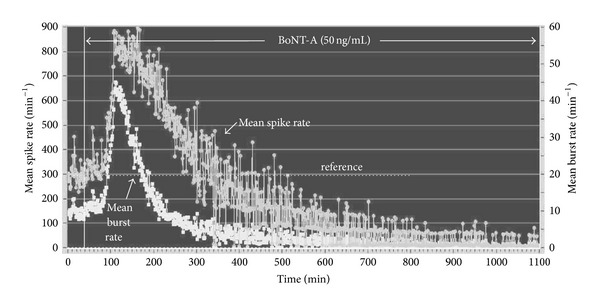
The botulinum toxins are potent agents which disrupt synaptic transmission. While the standard method for BoNT detection and quantification is based on the mouse lethality assay, we have examined whether alterations in cultured neuronal network activity can be used to detect the functional effects of BoNT. Murine spinal cord and frontal cortex networks cultured on substrate integrated microelectrode arrays allowed monitoring of spontaneous spike and burst activity with exposure to BoNT serotype A (BoNT-A). Exposure to BoNT-A inhibited spike activity in cultured neuronal networks where, after a delay due to toxin internalization, the rate of activity loss depended on toxin concentration. Over a 30 hr exposure to BoNT-A, the minimum concentration detected was 2 ng/mL, a level consistent with mouse lethality studies. A small proportion of spinal cord networks, but not frontal cortex networks, showed a transient increase in spike and burst activity with exposure to BoNT-A, an effect likely due to preferential inhibition of inhibitory synapses expressed in this tissue. Lastly, prior exposure to human-derived antisera containing neutralizing antibodies prevented BoNT-A induced inhibition of network spike activity. These observations suggest that the extracellular recording from cultured neuronal networks can be used to detect and quantify functional BoNT effects.
Figures
Similar articles
-
Cortical networks grown on microelectrode arrays as a biosensor for botulinum toxin.J Food Sci. 2008 Apr;73(3):E129-36. doi: 10.1111/j.1750-3841.2008.00690.x. J Food Sci. 2008. PMID: 18387107
-
Uptake of botulinum neurotoxin into cultured neurons.Biochemistry. 2004 Jan 20;43(2):526-32. doi: 10.1021/bi0356698. Biochemistry. 2004. PMID: 14717608
-
Embryonic Stem Cell-Derived Neurons Grown on Multi-Electrode Arrays as a Novel In vitro Bioassay for the Detection of Clostridium botulinum Neurotoxins.Front Pharmacol. 2017 Feb 23;8:73. doi: 10.3389/fphar.2017.00073. eCollection 2017. Front Pharmacol. 2017. PMID: 28280466 Free PMC article.
-
Mastoparan-7 rescues botulinum toxin-A poisoned neurons in a mouse spinal cord cell culture model.Toxicon. 2013 Dec 15;76:37-43. doi: 10.1016/j.toxicon.2013.09.002. Epub 2013 Sep 15. Toxicon. 2013. PMID: 24047963
-
Immunogenicity Associated with Botulinum Toxin Treatment.Toxins (Basel). 2019 Aug 26;11(9):491. doi: 10.3390/toxins11090491. Toxins (Basel). 2019. PMID: 31454941 Free PMC article. Review.
Cited by
-
Concentration-response evaluation of ToxCast compounds for multivariate activity patterns of neural network function.Arch Toxicol. 2020 Feb;94(2):469-484. doi: 10.1007/s00204-019-02636-x. Epub 2019 Dec 10. Arch Toxicol. 2020. PMID: 31822930 Free PMC article.
-
A novel low-cost electrode for recording the local field potential of freely moving rat's brain.Transl Neurosci. 2020 Jun 5;11(1):96-104. doi: 10.1515/tnsci-2020-0104. eCollection 2020. Transl Neurosci. 2020. PMID: 33312716 Free PMC article.
-
Accelerated intoxication of GABAergic synapses by botulinum neurotoxin A disinhibits stem cell-derived neuron networks prior to network silencing.Front Cell Neurosci. 2015 Apr 23;9:159. doi: 10.3389/fncel.2015.00159. eCollection 2015. Front Cell Neurosci. 2015. PMID: 25954159 Free PMC article.
-
A Novel 3D Helical Microelectrode Array for In Vitro Extracellular Action Potential Recording.Micromachines (Basel). 2022 Oct 8;13(10):1692. doi: 10.3390/mi13101692. Micromachines (Basel). 2022. PMID: 36296045 Free PMC article.
-
In Vitro Pharmacological Modulation of PIEZO1 Channels in Frontal Cortex Neuronal Networks.Brain Sci. 2024 Feb 27;14(3):223. doi: 10.3390/brainsci14030223. Brain Sci. 2024. PMID: 38539612 Free PMC article.
References
-
- Simpson LL. Identification of the major steps in botulinum toxin action. Annual Review of Pharmacology and Toxicology. 2004;44:167–193. - PubMed
-
- Rusnak JM, Smith LA. Botulinum neurotoxin vaccines: past history and recent developments. Human Vaccines. 2009;5(12):794–805. - PubMed
-
- Humeau Y, Doussau F, Grant NJ, Poulain B. How botulinum and tetanus neurotoxins block neurotransmitter release. Biochimie. 2000;82(5):427–446. - PubMed
-
- Devers KG, Nine JS. Autopsy findings in botulinum toxin poisoning. Journal of Forensic Sciences. 2010;55(6):1649–1651. - PubMed
-
- Truong DD, Jost WH. Botulinum toxin: clinical use. Parkinsonism and Related Disorders. 2006;12(6):331–355. - PubMed
LinkOut - more resources
Full Text Sources
Other Literature Sources
