

A new high-resolution spectral approach to noninvasively evaluate wall deformations in arteries
- PMID: 24688596
- PMCID: PMC3943247
- DOI: 10.1155/2014/606202
A new high-resolution spectral approach to noninvasively evaluate wall deformations in arteries
Abstract
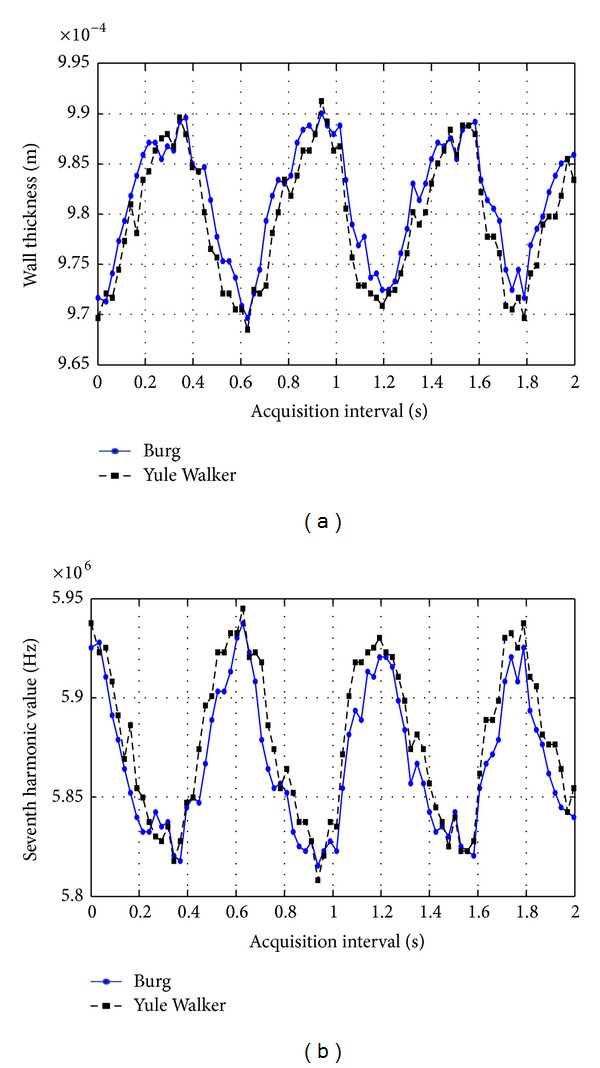
By locally measuring changes on arterial wall thickness as a function of pressure, the related Young modulus can be evaluated. This physical magnitude has shown to be an important predictive factor for cardiovascular diseases. For evaluating those changes, imaging segmentation or time correlations of ultrasonic echoes, coming from wall interfaces, are usually employed. In this paper, an alternative low-cost technique is proposed to locally evaluate variations on arterial walls, which are dynamically measured with an improved high-resolution calculation of power spectral densities in echo-traces of the wall interfaces, by using a parametric autoregressive processing. Certain wall deformations are finely detected by evaluating the echoes overtones peaks with power spectral estimations that implement Burg and Yule Walker algorithms. Results of this spectral approach are compared with a classical cross-correlation operator, in a tube phantom and "in vitro" carotid tissue. A circulating loop, mimicking heart periods and blood pressure changes, is employed to dynamically inspect each sample with a broadband ultrasonic probe, acquiring multiple A-Scans which are windowed to isolate echo-traces packets coming from distinct walls. Then the new technique and cross-correlation operator are applied to evaluate changing parietal deformations from the detection of displacements registered on the wall faces under periodic regime.
Figures


References
-
- Anderson KM, Odell PM, Wilson PWF, Kannel WB. Cardiovascular disease risk profiles. American Heart Journal. 1991;121(1):293–298. - PubMed
-
- De Backer G, Ambrosioni E, Borch-Johnsen K, et al. European guidelines on cardiovascular disease prevention in clinical practice: third Joint Task Force of European and other Societies on Cardiovascular Disease Prevention in clinical practice. European Heart Journal. 2003;24(17):1601–1610. - PubMed
-
- Simon A, Levenson J. May subclinical arterial disease help to better detect and treat high-risk asymptomatic individuals? Journal of Hypertension. 2005;23(11):1939–1945. - PubMed
-
- Bonnefous O, Pesqué P. Time domain formulation of pulse-Doppler ultrasound and blood velocity estimation by cross correlation. Ultrasonic Imaging. 1986;8(2):73–85. - PubMed
-
- Hoeks APG, Arts TGJ, Brands PJ, Reneman RS. Comparison of the performance of the RF cross correlation and Doppler autocorrelation technique to estimate the mean velocity of simulated ultrasound signals. Ultrasound in Medicine and Biology. 1993;19(9):727–740. - PubMed
Publication types
MeSH terms
LinkOut - more resources
Full Text Sources
Other Literature Sources
