Review
. 2013 Mar 22:4:e201301009.
doi: 10.5936/csbj.201301009. eCollection 2013.

Statistical methods for the analysis of high-throughput metabolomics data

Affiliations
Review

Statistical methods for the analysis of high-throughput metabolomics data

Jörg Bartel et al. Comput Struct Biotechnol J. .

Abstract

Metabolomics is a relatively new high-throughput technology that aims at measuring all endogenous metabolites within a biological sample in an unbiased fashion. The resulting metabolic profiles may be regarded as functional signatures of the physiological state, and have been shown to comprise effects of genetic regulation as well as environmental factors. This potential to connect genotypic to phenotypic information promises new insights and biomarkers for different research fields, including biomedical and pharmaceutical research. In the statistical analysis of metabolomics data, many techniques from other omics fields can be reused. However recently, a number of tools specific for metabolomics data have been developed as well. The focus of this mini review will be on recent advancements in the analysis of metabolomics data especially by utilizing Gaussian graphical models and independent component analysis.


Figures

Figure 1
Figure 1
Classical approaches to analyze metabolomics data. A) Differences in the concentration level of single metabolites between two or more groups (e.g. t-test, ANOVA). B) Multivariate approaches like PCA and PLS model the relationships between metabolites and/or samples to detect group differences. Data points represent observations (samples).
Figure 2
Figure 2
Gaussian graphical models applied to metabolomics data. A) Network representation of a Gaussian graphical model. Each node corresponds to a metabolite, whereas each edge represents a significant partial correlation. B) Reconstructed subgraphs correspond to known biological reactions. Line widths indicate partial correlations strength; Edges are labeled with enzymes that supposedly account for the observed correlation. We observe effects of fatty acid desaturation and elongation in phospholipids, as well as beta-oxidation signatures for acyl carnitines. lysoPC = lyso phosphatidylcholine, SM = sphingomyelin, carn = carnitine. C) The same GGM from A colored with gender-specific effects from a differential statistical analysis. In part adapted from [58].
Figure 3
Figure 3
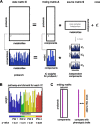
Concept of Bayesian independent component analysis. A) The data matrix of metabolite concentrations X is factorized into a mixing matrix A (containing contributions for each component in each proband) and a source matrix S (of statistically independent components, ICs). B) Functionally, we check for enriched metabolic pathways in each of the ICs to determine whether this statistical construct contains biological information. C) The mixing matrix values for each proband can be correlated with other traits, e.g. plasma HDL levels. Reprinted with permission from [76]. Copyright (2012) American Chemical Society.
Figure 4
Figure 4
Flow of biological information. Genomic information is transcribed into RNAs (A), which thereafter are translated into proteins (B). Proteins act in the regulation of transcription (e.g. as transcription factors, C) or directly on metabolite levels as enzymes or transporters (D). Metabolites, in turn, can regulate the activity of proteins for instance as ligands or via protein modifications (E). All organizational levels are affected by environmental factors like diet, lifestyle or mutagenic exposure (F).

References

    1. Oliver SG, Winson MK, Kell DB, Baganz F (1998) Systematic functional analysis of the yeast genome. Trends in Biotechnology 16: 373–378 - PubMed
    1. Ludwig C, Viant MR (2010) Two-dimensional J-resolved NMR spectroscopy: review of a key methodology in the metabolomics toolbox. Phytochem Anal 21: 22–32 - PubMed
    1. Roux A, Lison D, Junot C, Heilier J-F (2011) Applications of liquid chromatography coupled to mass spectrometry-based metabolomics in clinical chemistry and toxicology: A review. Clin Biochem 44: 119–135 - PubMed
    1. Patti GJ, Yanes O, Siuzdak G (2012) Innovation: Metabolomics: the apogee of the omics trilogy. Nature Reviews Molecular Cell Biology 13: 263–269 - PMC - PubMed
    1. Lindon JC, Holmes E, Nicholson JK (2006) Metabonomics techniques and applications to pharmaceutical research & development. Pharmaceutical research 23: 1075–1088 - PubMed

LinkOut - more resources