. 2014:2014:907420.
doi: 10.1155/2014/907420. Epub 2014 Feb 12.

Integrative analysis of miRNA-mRNA and miRNA-miRNA interactions

Affiliations

Integrative analysis of miRNA-mRNA and miRNA-miRNA interactions

Li Guo et al. Biomed Res Int. 2014.

Abstract

MicroRNAs (miRNAs) are small, noncoding regulatory molecules. They are involved in many essential biological processes and act by suppressing gene expression. The present work reports an integrative analysis of miRNA-mRNA and miRNA-miRNA interactions and their regulatory patterns using high-throughput miRNA and mRNA datasets. Aberrantly expressed miRNA and mRNA profiles were obtained based on fold change analysis, and qRT-PCR was used for further validation of deregulated miRNAs. miRNAs and target mRNAs were found to show various expression patterns. miRNA-miRNA interactions and clustered/homologous miRNAs were also found to contribute to the flexible and selective regulatory network. Interacting miRNAs (e.g., miRNA-103a and miR-103b) showed more pronounced differences in expression, which suggests the potential "restricted interaction" in the miRNA world. miRNAs from the same gene clusters (e.g., miR-23b gene cluster) or gene families (e.g., miR-10 gene family) always showed the same types of deregulation patterns, although they sometimes differed in expression levels. These clustered and homologous miRNAs may have close functional relationships, which may indicate collaborative interactions between miRNAs. The integrative analysis of miRNA-mRNA based on biological characteristics of miRNA will further enrich miRNA study.


Figures

Figure 1
Figure 1
The miRNA-mRNA integrative analysis.
Figure 2
Figure 2
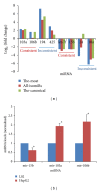
(a) miRNA expression analysis and (b) and further qRT-PCR validation. (a) The fold change values (log 2) differ in the variety of miRNA sequences involved. “The-most” indicates the most abundant and dominant isomiR sequence. “All-isomiRs” indicates sum of all isomiRs. “The-canonical” indicates the reference miRNA sequence in the miRBase database. The canonical miRNA sequence may be consistent or inconsistent with the most abundant isomiR sequence. Different methods of estimation may produce different fold change values (log 2), but they always show consistent deregulation patterns. (b) Further RT-PCR validation is performed for miR-15b, miR-103a, and miR-106b, and the experimental results show consistent deregulation patterns. “*” indicates that the P value is less than 0.05.
Figure 3
Figure 3
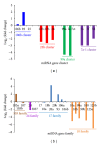
Examples of (a) deregulated miRNA gene clusters and (b) gene families. (a) Clustered and (b) homologous miRNAs are always consistently upregulated or downregulated in tumor cells, although they can differ in fold change values (log 2) and relative expression levels. miRNAs shown here to have zero change (such as miR-25) are not detected or did not show significant differences between tumor and normal cells.
Figure 4
Figure 4
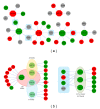
Examples of flexible and selective regulatory network between miRNAs and mRNAs. (a) Selected overexpressed (miR-103a, miR-106b, and miR-194) and underexpressed (miR-15b, miR-100, and miR-125b) miRNAs are used to reconstruct the regulatory network. Their experimentally validated target mRNAs show various expression patterns: some are stably expressed, and others are upregulated or downregulated. Overexpressed miRNAs and mRNAs are here highlighted in red octagons and ellipse, respectively, and underexpressed miRNAs and mRNAs are highlighted in green octagon and ellipse, respectively. Grey ellipses indicate stably expressed mRNAs and mRNAs are not detected in the present study. The targets common to different miRNAs are highlighted in blue rectangles. (b) Selected underexpressed miRNA gene clusters (miR-23b and let-7a-1) and gene families (miR-23 and miR-27) also show complex regulatory networks. These clustered and homologous members are consistently downregulated in tumor cells, and their validated targets show various expression patterns. miRNAs in the let-7a-1 gene cluster are also members of the let-7 gene family. The targets common to these miRNAs have shown upregulated, downregulated, and stable patterns of expression.

References

    1. Carthew RW, Sontheimer EJ. Origins and mechanisms of miRNAs and siRNAs. Cell. 2009;136(4):642–655. - PMC - PubMed
    1. Guo H, Ingolia NT, Weissman JS, Bartel DP. Mammalian microRNAs predominantly act to decrease target mRNA levels. Nature. 2010;466(7308):835–840. - PMC - PubMed
    1. Huntzinger E, Izaurralde E. Gene silencing by microRNAs: contributions of translational repression and mRNA decay. Nature Reviews Genetics. 2011;12(2):99–110. - PubMed
    1. Frankel LB, Christoffersen NR, Jacobsen A, Lindow M, Krogh A, Lund AH. Programmed cell death 4 (PDCD4) is an important functional target of the microRNA miR-21 in breast cancer cells. The Journal of Biological Chemistry. 2008;283(2):1026–1033. - PubMed
    1. Voorhoeve PM, le Sage C, Schrier M, et al. A genetic screen implicates miRNA-372 and miRNA-373 as oncogenes in testicular germ cell tumors. Cell. 2006;124(6):1169–1181. - PubMed

Publication types

LinkOut - more resources