

Finite element analysis applied to 3-T MR imaging of proximal femur microarchitecture: lower bone strength in patients with fragility fractures compared with control subjects
- PMID: 24689884
- PMCID: PMC4263634
- DOI: 10.1148/radiol.14131926
Finite element analysis applied to 3-T MR imaging of proximal femur microarchitecture: lower bone strength in patients with fragility fractures compared with control subjects
Abstract
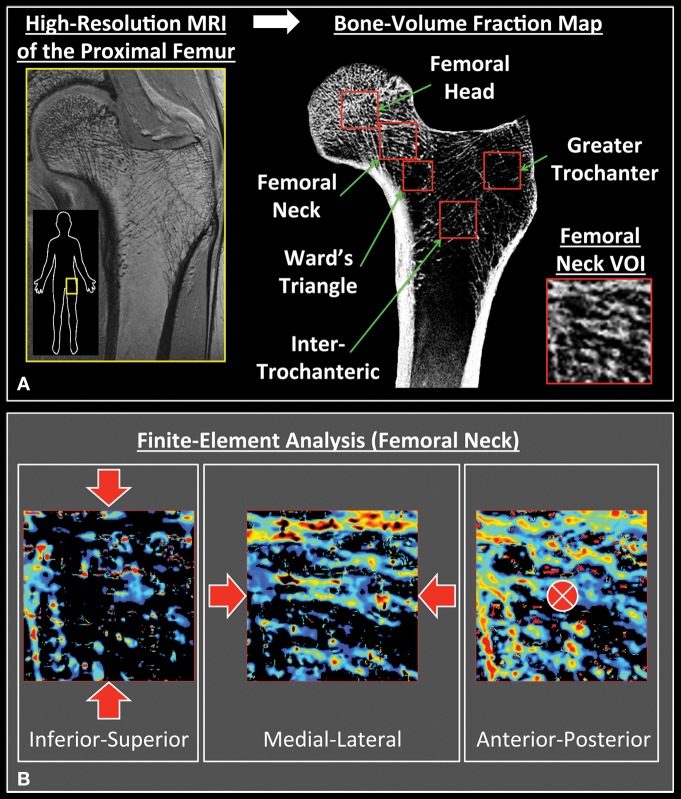
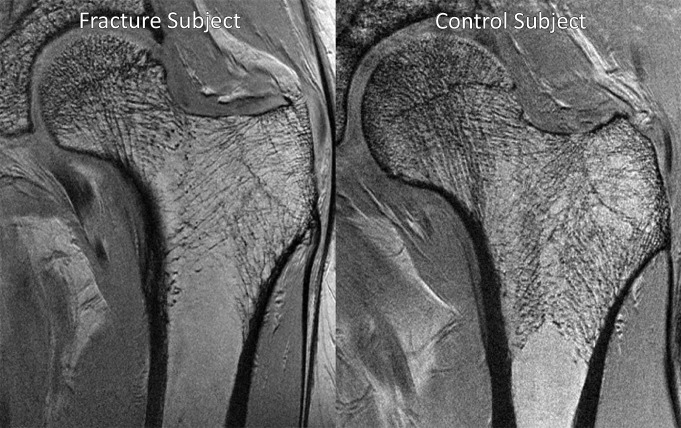
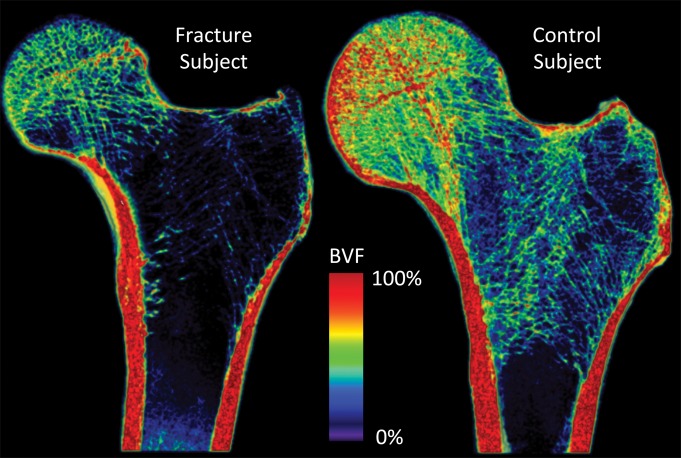
Purpose: To determine the feasibility of using finite element analysis applied to 3-T magnetic resonance (MR) images of proximal femur microarchitecture for detection of lower bone strength in subjects with fragility fractures compared with control subjects without fractures.
Materials and methods: This prospective study was institutional review board approved and HIPAA compliant. Written informed consent was obtained. Postmenopausal women with (n = 22) and without (n = 22) fragility fractures were matched for age and body mass index. All subjects underwent standard dual-energy x-ray absorptiometry. Images of proximal femur microarchitecture were obtained by using a high-spatial-resolution three-dimensional fast low-angle shot sequence at 3 T. Finite element analysis was applied to compute elastic modulus as a measure of strength in the femoral head and neck, Ward triangle, greater trochanter, and intertrochanteric region. The Mann-Whitney test was used to compare bone mineral density T scores and elastic moduli between the groups. The relationship (R(2)) between elastic moduli and bone mineral density T scores was assessed.
Results: Patients with fractures showed lower elastic modulus than did control subjects in all proximal femur regions (femoral head, 8.51-8.73 GPa vs 9.32-9.67 GPa; P = .04; femoral neck, 3.11-3.72 GPa vs 4.39-4.82 GPa; P = .04; Ward triangle, 1.85-2.21 GPa vs 3.98-4.13 GPa; P = .04; intertrochanteric region, 1.62-2.18 GPa vs 3.86-4.47 GPa; P = .006-.007; greater trochanter, 0.65-1.21 GPa vs 1.96-2.62 GPa; P = .01-.02), but no differences in bone mineral density T scores. There were weak relationships between elastic moduli and bone mineral density T scores in patients with fractures (R(2) = 0.25-0.31, P = .02-.04), but not in control subjects. CONCLUSION Finite element analysis applied to high-spatial-resolution 3-T MR images of proximal femur microarchitecture can allow detection of lower elastic modulus, a marker of bone strength, in subjects with fragility fractures compared with control subjects. MR assessment of proximal femur strength may provide information about bone quality that is not provided by dual-energy x-ray absorptiometry.
Figures
Comment in
-
Spatial resolution for finite element analysis.Radiology. 2015 Feb;274(2):622. doi: 10.1148/radiol.14141830. Radiology. 2015. PMID: 25625746 No abstract available.
-
Response.Radiology. 2015 Feb;274(2):622-3. Radiology. 2015. PMID: 25785289 No abstract available.
References
-
- Consensus development conference : diagnosis, prophylaxis, and treatment of osteoporosis. Am J Med 1993;94(6):646–650. - PubMed
-
- Kanis JA. Diagnosis of osteoporosis and assessment of fracture risk. Lancet 2002;359(9321):1929–1936. - PubMed
-
- Burge R, Dawson-Hughes B, Solomon DH, Wong JB, King A, Tosteson A. Incidence and economic burden of osteoporosis-related fractures in the United States, 2005-2025. J Bone Miner Res 2007;22(3):465–475. - PubMed
-
- Cummings SR, Bates D, Black DM. Clinical use of bone densitometry: scientific review. JAMA 2002;288(15):1889–1897. - PubMed
MeSH terms
Grants and funding
LinkOut - more resources
Full Text Sources
Other Literature Sources
Medical
