

Review
doi: 10.1021/cb500079s.
Epub 2014 Apr 30.
Directing the immune system with chemical compounds
Affiliations
- PMID: 24690004
- PMCID: PMC5674983
- DOI: 10.1021/cb500079s
Item in Clipboard
Review
Directing the immune system with chemical compounds
ACS Chem Biol.
.
Abstract
Agonists of immune cell receptors direct innate and adaptive immunity. These agonists range in size and complexity from small molecules to large macromolecules. Here, agonists of a class of immune cell receptors known as the Toll-like receptors (TLRs) are highlighted focusing on the distinctive molecular moieties that pertain to receptor binding and activation. How the structure and combined chemical signals translate into a variety of immune responses remain major questions in the field. In this structure-focused review, we outline potential areas where the tools of chemical biology could help decipher the emerging molecular codes that direct immune stimulation.
Figures
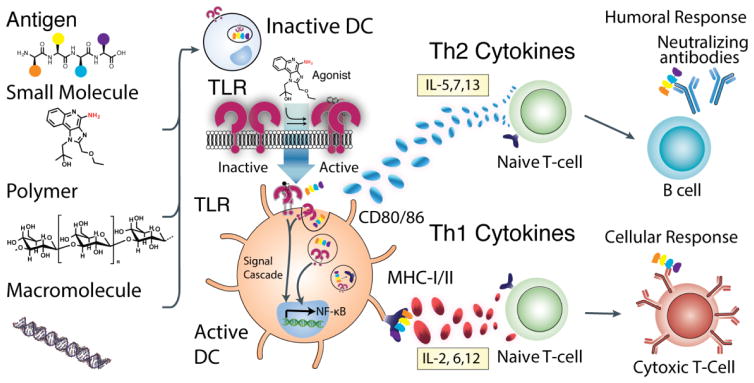
Overall pathway of DC Activation. A series of molecular signals, each a specific agonist for different TLRs are presented alongside an antigen. Dimerization of TLRs activates downstream signaling “maturing” the dendritic cell. Mature cells present the antigen on the major histocompatibility complex along with co-stimulatory and recognition proteins (e.g. CD80/CD86) and signaling cytokines that further the immune response. A Th1 response involves secretion of many cytokines, but notable ones include IL-6 and IL-12. This then elicits a cytotoxic T cell response with antibodies directing cytotoxic cells towards a specific antigen. A Th2 response is the production of soluble antibodies via activated B cells. The marked cytokines include IL-5 and -7.
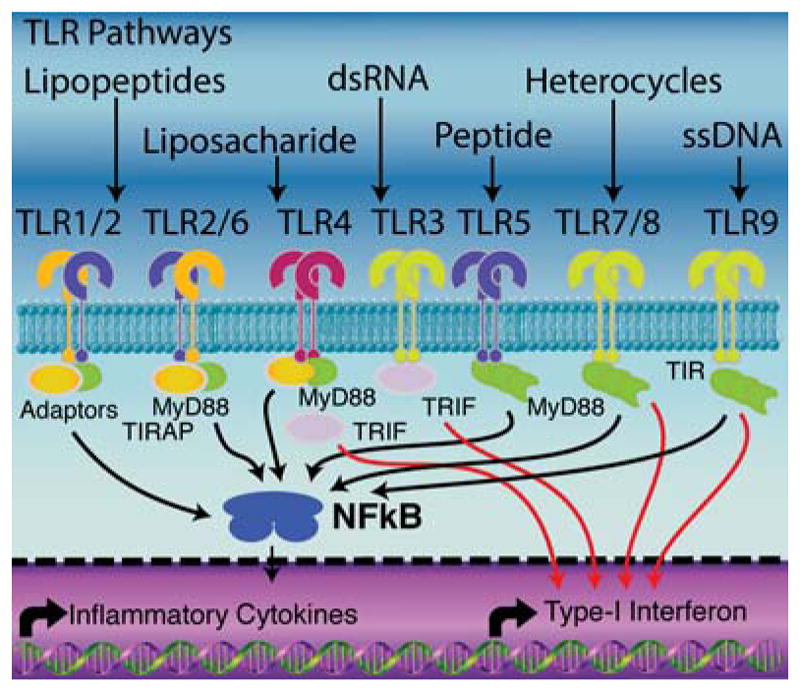
General signaling cascades responsible for downstream activation of TLRs. Activation of TLRs activates the NFκB pathway triggering expression and production of inflammatory cytokines and interferons. Activated cells also up-regulate the expression of MHCI/II, CD80/86 and CD40. MyD88 is the predominant adaptor protein between TLR activation and inflammatory cytokines. TRIF is the other major adaptor protein. Many synergies occur through the simultaneous activation of both pathways.
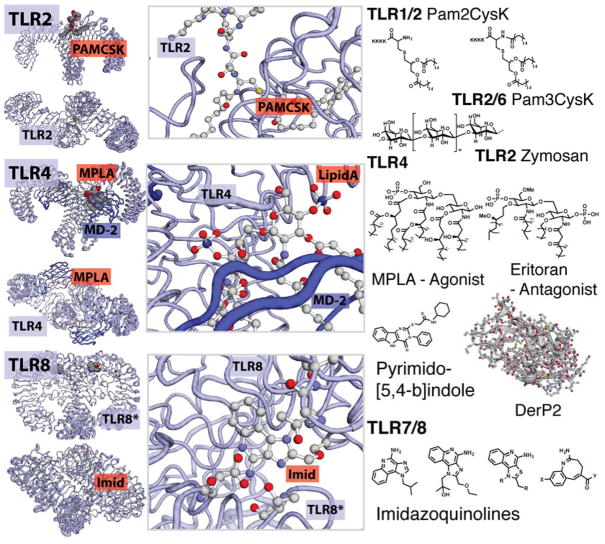
Small molecule binding TLRs. Structures of TLRs and structural information of their small molecule interactions. TLR2 agonists include palmitoylated peptides as well as polymeric saccharides. The structure of TLR2/6 bound with a PAMCys derivative is shown. TLR4, agonists include Lipid A derivatives, a pyrimido-[5,4-b]indole and the protein DerP2. The crystal structure of Lipid A bound within the TLR4 is shown. Hydrophobic interactions drive the association of MD2 and TLR4 mediated by the lipid tails of these derivatives. TLR8, several molecules containing an moiety bind TLR7 or TLR8. Variations in structure can increase specificity for either TLR7 or TLR8. In addition, in vivo, TLR7 and 8 bind ssRNA. The crystal structural of TLR8 is shown with the agonist R848, Resiqiumod, the amino acids responsible for binding are shown.
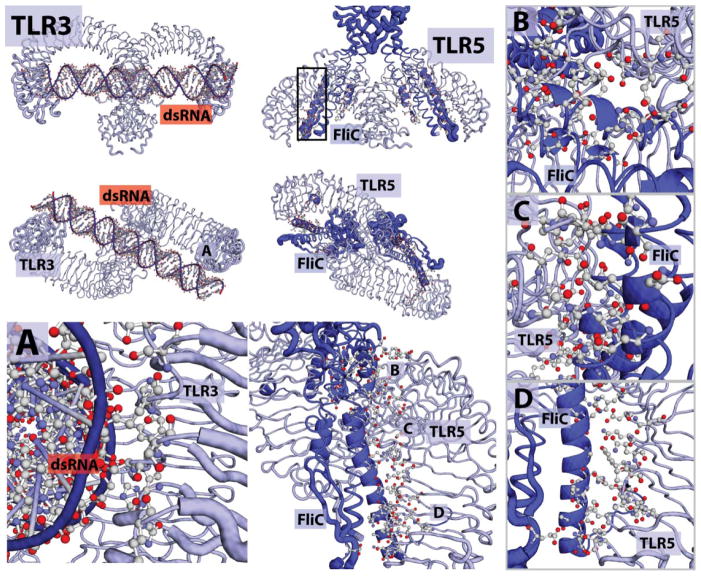
TLRs that bind macromolecules. Structures of agonists and structural information. TLR3, is shown binding dsRNA from top-down and front-forward structure. There are two sections of association. A) Binding interaction of TLR and dsRNA, relevant amino-acids and active phosphates are shown. TLR5 is shown associated with the FLiC, Flagellin peptide B-D) Different locations of interaction. The FliC elements are associated with three clusters of the TLR5 backbone. Each is important for recognition and dimerization.
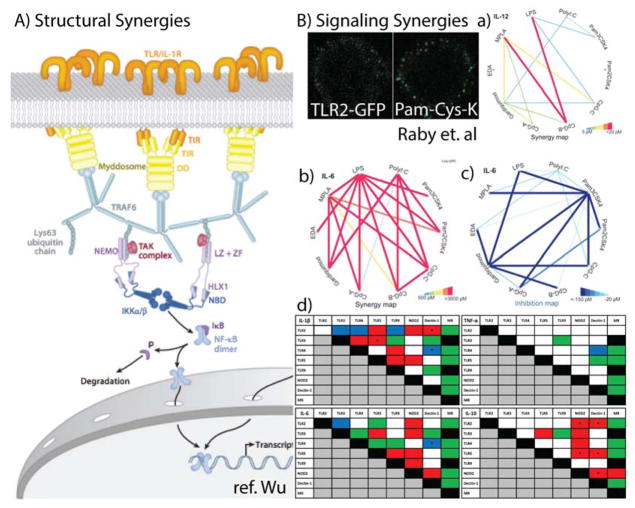
Overview of PRR synergies. A) A proposed dynamic structure of the TLR signalasome. TLRs are shown in orange at the top. An example of TLR clusters are shown as well. B) Signaling Synergies. Interaction maps of different agonists portraying synergies as heat maps. Red indicates a greater interaction while blue represents inhibitory interactions. The thickness of the line indicates strength of synergistic activity. Tables of PRR synergies found in PBMCs. Color indicates type of interaction in at least 7 of 10 of the healthy volunteers. Red, synergistic effect; green, no effect/additive effect; blue, inhibitory effect; white, variable effect; black, experiment not performed.
References
Publication types
MeSH terms
Substances
Grants and funding
LinkOut - more resources
Full Text Sources
Other Literature Sources
