. 2014 Apr 2;14(1):70.
doi: 10.1186/1471-2148-14-70.

Revealing the maternal demographic history of Panthera leo using ancient DNA and a spatially explicit genealogical analysis

Affiliations

Revealing the maternal demographic history of Panthera leo using ancient DNA and a spatially explicit genealogical analysis

Ross Barnett et al. BMC Evol Biol. .

Abstract

Background: Understanding the demographic history of a population is critical to conservation and to our broader understanding of evolutionary processes. For many tropical large mammals, however, this aim is confounded by the absence of fossil material and by the misleading signal obtained from genetic data of recently fragmented and isolated populations. This is particularly true for the lion which as a consequence of millennia of human persecution, has large gaps in its natural distribution and several recently extinct populations.

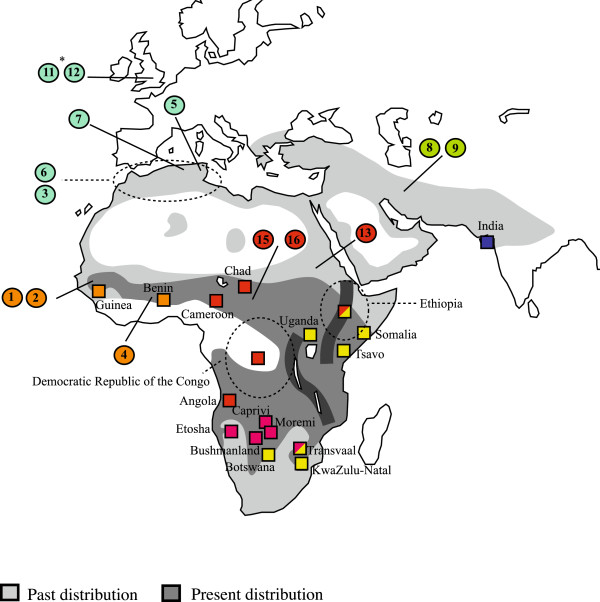
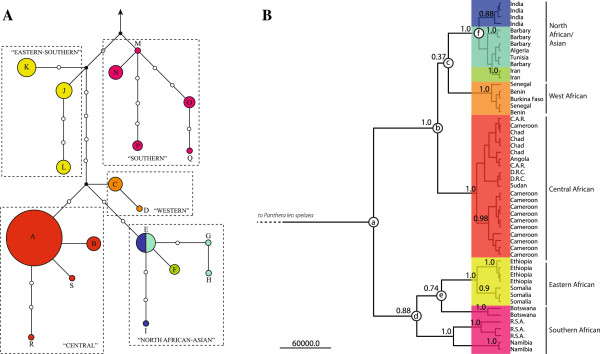
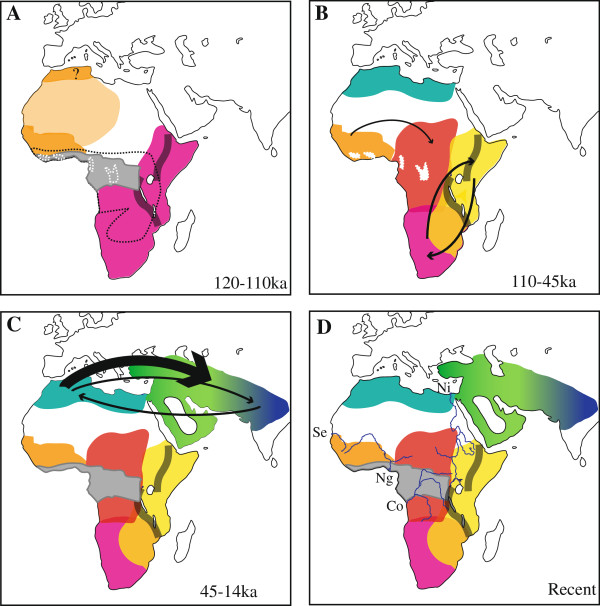
Results: We sequenced mitochondrial DNA from museum-preserved individuals, including the extinct Barbary lion (Panthera leo leo) and Iranian lion (P. l. persica), as well as lions from West and Central Africa. We added these to a broader sample of lion sequences, resulting in a data set spanning the historical range of lions. Our Bayesian phylogeographical analyses provide evidence for highly supported, reciprocally monophyletic lion clades. Using a molecular clock, we estimated that recent lion lineages began to diverge in the Late Pleistocene. Expanding equatorial rainforest probably separated lions in South and East Africa from other populations. West African lions then expanded into Central Africa during periods of rainforest contraction. Lastly, we found evidence of two separate incursions into Asia from North Africa, first into India and later into the Middle East.

Conclusions: We have identified deep, well-supported splits within the mitochondrial phylogeny of African lions, arguing for recognition of some regional populations as worthy of independent conservation. More morphological and nuclear DNA data are now needed to test these subdivisions.


Figures

Figure 1
Figure 1
A map of the source areas for the lion samples analysed in this study. Numbers within circles correspond to PL numbers in Table 1. Squares correspond to sequences available on Genbank and identified in Additional file 3: Table S1. Colours of squares and circles correspond to those used in Figure 2. *PL11 and PL12 are medieval English lions that have been identified as North African lions (P. leo leo) based on mitochondrial HVR sequences and morphological data.
Figure 2
Figure 2
Phylogenetic analyses of lion sequence data. A) Median network of 1051 bp of cytb for all 88 lion individuals identified from GenBank plus those generated in this study. Panthera leo spelaea was used as an outgroup. Circles are proportional to haplotype frequencies and black circles represent hypothesized intermediate haplotypes. The number of links represent the number of mutations between haplotypes. Haplotypes are labelled from A to S and correspond to sequences labelled in Table 1 and Additional file 3: Table S1. B) Phylogenetic tree from a Bayesian analysis of combined cytb and control region data for all lion taxa where available (n = 54). Posterior probabilities of supported clades are shown at nodes. Estimates of divergence times: (a) 124,200 years (95% credibility: 81,800-183,500); (b) 61,500 years (32,700-97,300); (c) 51,000 years (26,600-83,100); (d) 81,900 years (45,700-122,200); (e) 57,800 years (26,800-96,600); (f) 21,100 years (8300–38,800). Branch colours correspond to reconstructed ancestral geographic states (Purple, South Africa; Yellow, East Africa; Orange, West Africa; Red, Central Africa; Teal, North Africa; Blue, South Asia; Green, Near-East). Tip colours correspond to origins of samples.
Figure 3
Figure 3
Reconstructed distribution of the modern lion at different times. Estimates of spatial diffusion pathways at Marine Isotope Stage (MIS) time points: A. MIS5 B. MIS4-MIS3 C. MIS2-MIS1 D. Estimated natural distribution prior to anthropogenic disturbance. Black arrows show estimated spatial diffusions, with thicknesses proportional to Bayes factors. Movement from East Africa to South Africa (4.83), from South Africa to East Africa (4.66), from West Africa to Central Africa (3.00), from North Africa to South Asia (4.37), from South Asia to North Africa (4.50), from North Africa to Middle East (21.03). Tropical rainforest is shown in light grey (present distribution), maximal extent during humid periods (black dashed line), and minimal extent during arid periods (white dashed line). The Great Rift Valley is shown in dark grey. African rivers are shown in blue. Co, Congo; Ng, Niger; Ni, Nile; Se, Senegal.

References

    1. Mellows A, Barnett R, Dalen L, Sandoval-Castellanos E, Linderholm A, McGovern TH, Church MJ, Larson G. The impact of past climate change on genetic variation and population connectivity in the Icelandic arctic fox. Proc Biol Sci. 2012;279(1747):4568–4573. doi: 10.1098/rspb.2012.1796. - DOI - PMC - PubMed
    1. Dalén L, Nyström V, Valdiosera C, Germonpre M, Sablin M, Turner E, Angerbjörn A, Arsuaga JL, Götherstrom A. Ancient DNA reveals lack of postglacial habitat tracking in the arctic fox. Proc Natl Acad Sci U S A. 2007;104(16):6726–6729. doi: 10.1073/pnas.0701341104. - DOI - PMC - PubMed
    1. Crandall KA, Bininda-Emonds ORP, Mace GM, Wayne RK. Considering evolutionary processes in conservation biology. Trends Ecol Evol. 2000;15(7):290–295. doi: 10.1016/S0169-5347(00)01876-0. - DOI - PubMed
    1. Lorenzen ED, Nogues-Bravo D, Orlando L, Weinstock J, Binladen J, Marske KA, Ugan A, Borregaard MK, Gilbert MT, Nielsen R, Ho SYW, Goebel T, Graf KE, Byers D, Stenderup JT, Rasmussen M, Campos PF, Leonard JA, Koepfli KP, Froese D, Zazula G, Stafford TW Jr, Aaris-Sorensen K, Batra P, Haywood AM, Singarayer JS, Valdes PJ, Boeskorov G, Burns JA, Davydov SP. et al.Species-specific responses of Late Quaternary megafauna to climate and humans. Nature. 2011;479(7373):359–364. doi: 10.1038/nature10574. - DOI - PMC - PubMed
    1. Lorenzen ED, Heller R, Siegismund HR. Comparative phylogeography of African savannah ungulates. Mol Ecol. 2012;21(15):3656–3670. doi: 10.1111/j.1365-294X.2012.05650.x. - DOI - PubMed

Publication types

Substances