. 2014 Apr 1;15(4):r54.
doi: 10.1186/gb-2014-15-4-r54.

DNA methylome profiling of human tissues identifies global and tissue-specific methylation patterns

DNA methylome profiling of human tissues identifies global and tissue-specific methylation patterns

Kaie Lokk et al. Genome Biol. .

Erratum in

Abstract

Background: DNA epigenetic modifications, such as methylation, are important regulators of tissue differentiation, contributing to processes of both development and cancer. Profiling the tissue-specific DNA methylome patterns will provide novel insights into normal and pathogenic mechanisms, as well as help in future epigenetic therapies. In this study, 17 somatic tissues from four autopsied humans were subjected to functional genome analysis using the Illumina Infinium HumanMethylation450 BeadChip, covering 486 428 CpG sites.

Results: Only 2% of the CpGs analyzed are hypermethylated in all 17 tissue specimens; these permanently methylated CpG sites are located predominantly in gene-body regions. In contrast, 15% of the CpGs are hypomethylated in all specimens and are primarily located in regions proximal to transcription start sites. A vast number of tissue-specific differentially methylated regions are identified and considered likely mediators of tissue-specific gene regulatory mechanisms since the hypomethylated regions are closely related to known functions of the corresponding tissue. Finally, a clear inverse correlation is observed between promoter methylation within CpG islands and gene expression data obtained from publicly available databases.

Conclusions: This genome-wide methylation profiling study identified tissue-specific differentially methylated regions in 17 human somatic tissues. Many of the genes corresponding to these differentially methylated regions contribute to tissue-specific functions. Future studies may use these data as a reference to identify markers of perturbed differentiation and disease-related pathogenic mechanisms.


Figures

Figure 1
Figure 1
Correlation of methylation intensities between tissues. The mean methylation levels of each CpG site within different specimens of the same tissue were compared and the PCC was calculated. The correlation matrix of different tissues is shown; the tissues appear to show a similar trend, for which the highest correlations occur between functionally similar tissues.
Figure 2
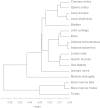
Figure 2
Hierarchical clustering of the 17 tissues studied. Hierarchical clustering analysis was performed using the hclust command in R. All of the samples were merged according to their corresponding tissues, which resulted in a matrix of the mean beta values for all of the CpG sites detected in the 17 total tissues. The clustering tree was generated using the complete method. The tree shows strong correlation between similar tissue types.
Figure 3
Figure 3
DNA methylation in specific gene regions. Distribution of DNA methylation in specific gene regions is shown. Each gene region is further divided into bins that correspond to beta values with 0.1 intervals. The area of each bin corresponds to total number of CpGs. The overall distribution and the mean of beta value of the CpGs in each gene region are shown as a box plot. The most unmethylated regions are associated with promoter sequences (TSS1500, TSS200, and 5′-UTR) and the first exon, while the most methylated regions are in the gene body and 3′-UTR. The numbers on the x-axis correspond to total number of CpGs in each gene region; also the x-axis shows different gene regions, and the y-axis shows the beta values.
Figure 4
Figure 4
CGI methylation in different genomic regions. Distribution of DNA methylation in specific gene regions is shown. Each gene region is further divided into bins that correspond to beta values with 0.1 intervals. The area of each bin corresponds to total number of CpGs. The overall distribution and the mean of beta value of the CpGs in each gene region are shown as a box plot. (A) The distribution of DNA methylation in CGI and non-CGI regions shows that the CGI itself is largely unmethylated and that the shores and shelves are methylated. (B, C) The distribution of CGI and non-CGI DNA methylation in intergenic (B) and intragenic (C) regions. (A-C) The numbers on the x-axis correspond to total number of CpGs in each gene region; also the x-axis shows different genomic regions, and the y-axis shows the beta values.
Figure 5
Figure 5
DNA methylation distribution in CGI and non-CGI regions. Distribution of DNA methylation in specific gene regions is shown. Each gene region is further divided into bins that correspond to beta values with 0.1 intervals. The area of each bin corresponds to total number of CpGs. The overall distribution and the mean of beta value of the CpGs in each gene region are shown as a box plot. (A) DNA methylation is low in promoter areas, but high in non-CGI regions of all gene areas (B). (A-B) The numbers on the x-axis correspond to total number of CpGs in each gene region; also the x-axis shows different genomic regions, and the y-axis shows the beta values.
Figure 6
Figure 6
Variance explained by the tissues and individuals. Figure is showing the distribution of the R squared statistic obtained for each CpG site. It is clearly visible, that variance explained by the individuals is insignificant - on average individuals explain only 6.4% of the variance whereas tissues explain 51.2%.
Figure 7
Figure 7
DNA methylation and gene expression correlation in CGI-promoter regions and the gene body. (A) Correlation analysis of CGI-promoter methylation and gene expression show that genes with low expression have high methylation. (B) Gene body methylation and gene expression are not correlated. (A, B) The x-axis shows DNA methylation beta values, and the y-axis shows gene expression values. The different tissues studied are represented by the following symbols: aortas (•), coronary artery (●), bladder (formula image), bone (formula image), bone marrows (formula image), lymph node (formula image), medulla oblongata (+), and tonsils (×).

References

    1. Bird AP. CpG-rich islands and the function of DNA methylation. Nature. 1986;321:209–213. doi: 10.1038/321209a0. - DOI - PubMed
    1. Bird A. DNA methylation patterns and epigenetic memory. Genes Dev. 2002;16:6–21. doi: 10.1101/gad.947102. - DOI - PubMed
    1. Madrigano J, Baccarelli A, Mittleman MA, Sparrow D, Vokonas PS, Tarantini L, Schwartz J. Aging and epigenetics: longitudinal changes in gene-specific DNA methylation. Epigenetics. 2012;7:63–70. doi: 10.4161/epi.7.1.18749. - DOI - PMC - PubMed
    1. Bind MA, Baccarelli A, Zanobetti A, Tarantini L, Suh H, Vokonas P, Schwartz J. Air pollution and markers of coagulation, inflammation, and endothelial function: associations and epigene-environment interactions in an elderly cohort. Epidemiology. 2012;23:332–340. doi: 10.1097/EDE.0b013e31824523f0. - DOI - PMC - PubMed
    1. Liu L, Wylie RC, Andrews LG, Tollefsbol TO. Aging, cancer and nutrition: the DNA methylation connection. Mech Ageing Dev. 2003;124:989–998. doi: 10.1016/j.mad.2003.08.001. - DOI - PubMed

Publication types