. 2014 Apr 1;4(4):e377.
doi: 10.1038/tp.2014.15.

Oxidative stress induces mitochondrial dysfunction in a subset of autistic lymphoblastoid cell lines

Affiliations

Oxidative stress induces mitochondrial dysfunction in a subset of autistic lymphoblastoid cell lines

S Rose et al. Transl Psychiatry. .

Erratum in

Abstract

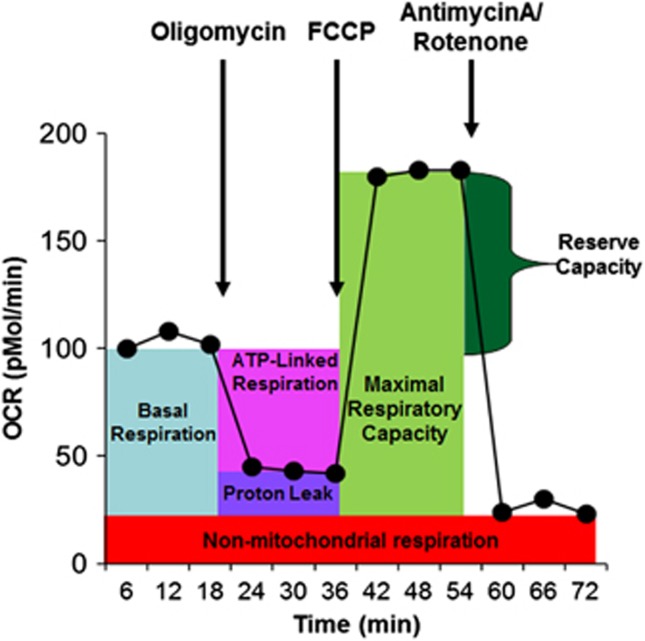
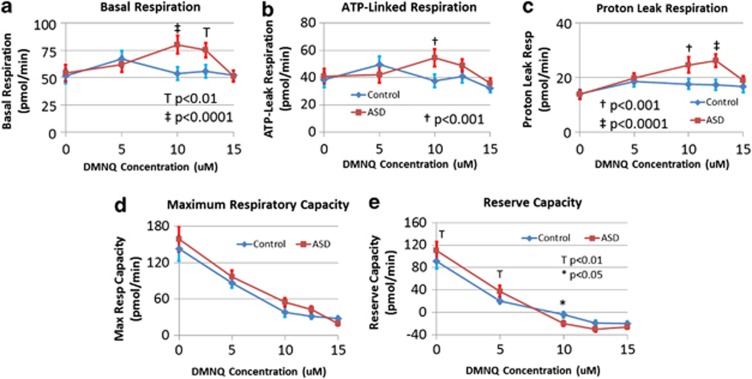
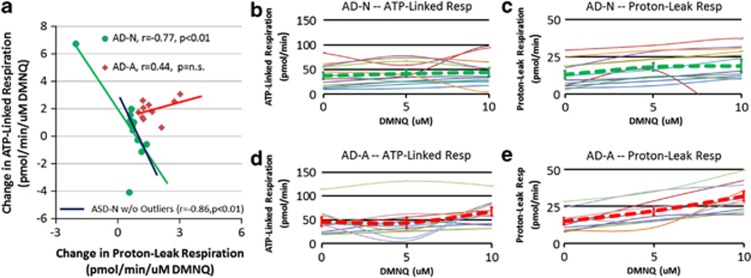
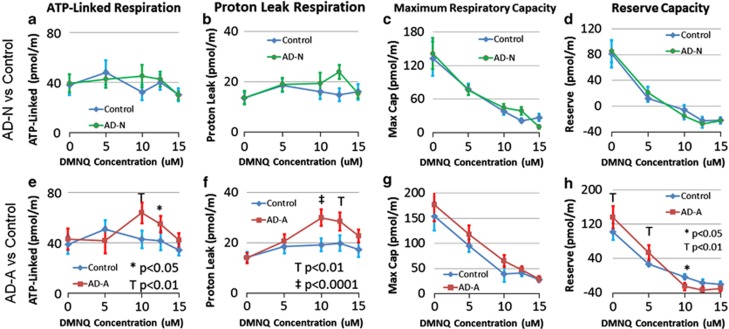
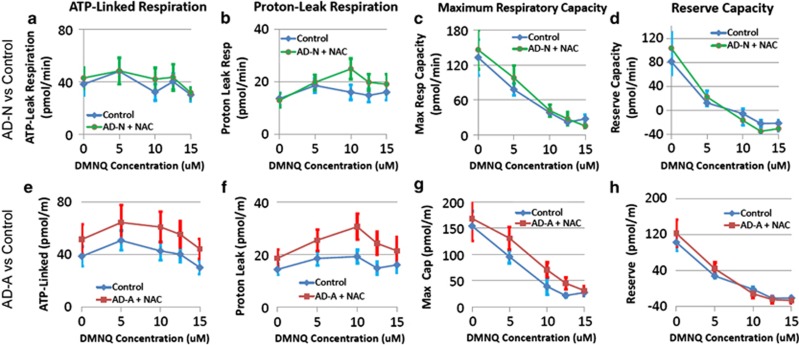
There is an increasing recognition that mitochondrial dysfunction is associated with autism spectrum disorders. However, little attention has been given to the etiology of mitochondrial dysfunction and how mitochondrial abnormalities might interact with other physiological disturbances such as oxidative stress. Reserve capacity is a measure of the ability of the mitochondria to respond to physiological stress. In this study, we demonstrate, for the first time, that lymphoblastoid cell lines (LCLs) derived from children with autistic disorder (AD) have an abnormal mitochondrial reserve capacity before and after exposure to reactive oxygen species (ROS). Ten (44%) of 22 AD LCLs exhibited abnormally high reserve capacity at baseline and a sharp depletion of reserve capacity when challenged with ROS. This depletion of reserve capacity was found to be directly related to an atypical simultaneous increase in both proton-leak respiration and adenosine triphosphate-linked respiration in response to increased ROS in this AD LCL subgroup. In this AD LCL subgroup, 48-hour pretreatment with N-acetylcysteine, a glutathione precursor, prevented these abnormalities and improved glutathione metabolism, suggesting a role for altered glutathione metabolism associated with this type of mitochondrial dysfunction. The results of this study suggest that a significant subgroup of AD children may have alterations in mitochondrial function, which could render them more vulnerable to a pro-oxidant microenvironment as well as intrinsic and extrinsic sources of ROS such as immune activation and pro-oxidant environmental toxins. These findings are consistent with the notion that AD is caused by a combination of genetic and environmental factors.


Figures

Figure 1
Figure 1
The Seahorse assay. Oxygen consumption rate is measured before and after adding pharmacological agents to respiring cells. Measurement of oxygen consumption over 6 min is made repeatedly. Three measurements are made and averaged to provide reliable measurements. For the first 18 min, total cellular oxygen consumption is measured. Basal respiration can be calculated from this quantity by subtracting non-mitochondrial respiration. Next oligomycin, an inhibitor of adenosine-5'-triphosphate (ATP) respiration, is added and a measurement of this is made over the next 18 min. This quantity can be subtracted from the total cellular oxygen consumption to determine ATP-linked respiration and non-mitochondrial respiration can be subtracted from this quantity to obtain proton-leak respiration. Next carbonyl cyanide-p-trifluoromethoxyphenyl-hydrazon, a protonophore, is added and a measurement of this is made over the next 18 min. The protonophore collapses the inner membrane gradient by making the inner membrane permeable to protons. This drives the electron transport chain to function at its maximum rate. Subtracting non-mitochondrial respiration from this quantity produces a measure of maximum respiratory capacity. Finally antimycin A, a complex III inhibitor, and rotenone, a complex I inhibitor, are added to shut down electron transport chain function. The resulting measurement over the next 18 min represents non-mitochondrial respiration, a measurement that can be used with the other measurements to calculate respiratory parameters. Finally, reserve capacity is calculated by subtracting basal respiration from maximum respiratory capacity.
Figure 2
Figure 2
Lymphoblastoid cell lines (LCLs) derived from children with autistic disorder (AD) demonstrate differences in mitochondrial function as compared with control LCLs at baseline and after exposure to the redox cycling agent 2,3-dimethoxy-1,4-napthoquinone (DMNQ) at four concentrations (5, 10, 12.5 and 15 μM) one hour before the assay. (a) Basal respiration increases as DMNQ concentration increases in the AD LCLs and becomes significantly higher in the AD LCLs at 10 and 12.5 μM DMNQ; (b) adenosine-5'-triphosphate-linked respiration increases as DMNQ concentration increases in the AD LCLs and becomes significantly higher in the AD LCLs at 10 μM DMNQ; (c) proton-leak respiration increases as DMNQ concentration increases in the AD LCLs and becomes significantly higher in the AD LCLs at 10 and 12.5 μM DMNQ; (d) maximum respiratory capacity decreased as DMNQ increased for both AD and control LCLs but overall AD LCLs demonstrated a higher maximum respiratory capacity; (e) reserve capacity decreases as DMNQ increases for both AD and control LCLs but the decline in reserve capacity is much sharper for the AD LCLs as compared with the control LCLs due to the fact that reserve capacity is significantly higher in the AD LCLs at low DMNQ concentrations but becomes significantly lower in the AD LCL at higher DMNQ concentrations.
Figure 3
Figure 3
Clustering of lymphoblastoid cell lines (LCLs) derived from children with autistic disorder (AD) into two subgroups: the AD-N subgroup has mitochondrial respiratory profiles similar to controls and the AD-A subgroup has atypical mitochondrial respiratory profiles. (a) AD-N cases (green circles) and AD-A cases (red diamonds) represent the two subgroups. The AD-N subgroup demonstrates a negative correlation between adenosine-5'-triphosphate (ATP)-linked respiration and proton-leak respiration (r=−0.77, P<0.01, green line) whereas the AD-A group demonstrates a positive correlation between ATP-linked respiration and proton-leak respiration (r=0.44, P=NS, red line). If the two outliers are removed from the AD-N group, the correlation is still significant (r=−0.86, P<0.01; blue line). (b) Individual (thin lines) and overall (thick green dashed line) change in ATP-linked respiration for the AD-N groups. Notice that there is little change overall. (c) Individual (thin lines) and overall (thick green dashed line) change in proton-leak respiration for the AD-N groups. Notice that there is little change overall. (d) Individual (thin lines) and overall (thick red dashed line) change in ATP-linked respiration for the AD-A groups. Notice that, overall, ATP-linked respiration increases with DMNQ concentration. (e) Individual (thin lines) and overall (thick red dashed line) change in proton-leak respiration for the AD-A groups. Notice that, overall, proton-leak respiration increases with DMNQ concentration. DMNQ, 2,3-dimethoxy-1,4-napthoquinone; NS, not significant.
Figure 4
Figure 4
Seahorse respiratory measurements in two subgroups of lymphoblastoid cell lines (LCLs) derived from children with autistic disorder (AD) as compared with control LCLs at baseline and after exposure to the redox cycling agent 2,3-dimethoxy-1,4-napthoquinone (DMNQ) at four concentrations (5, 10, 12.5 and 15 μM) one hour before the assay. Overall, the AD-A subgroup (eh) parallels the differences between the AD and control LCLs found in the overall analysis whereas the AD-N subgroup (ad) demonstrates similar mitochondrial response between the AD LCLs and control LCLs. For the AD-N subgroup (a) adenosine-5'-triphosphate(ATP)-linked respiration, (b) proton-leak respiration, (c) maximum respiratory capacity and (d) reserve capacity are similar between the AD and control LCLs. For the AD-A subgroup, (e) ATP-linked respiration increases as DMNQ concentration increases in the AD-A LCLs and becomes significantly higher in the AD-A LCLs at 10 μM DMNQ; (f) proton-leak respiration increases as DMNQ concentration increases in the AD-A LCLs and becomes significantly higher in the AD-A LCLs at 10 μM and 12.5 μM DMNQ; (g) maximum respiratory capacity decreased as DMNQ increased for both AD-A and control LCLs but overall AD-A LCLs demonstrated a higher maximum respiratory capacity; (h) the decline in reserve capacity is much sharper for the AD-A LCLs as compared with the control LCLs due to the fact that reserve capacity is significantly higher in the AD-A LCLs at low DMNQ concentrations but becomes significantly lower in the AD-A LCL at higher DMNQ concentrations.
Figure 5
Figure 5
Seahorse respiratory measurements in two subgroups of lymphoblastoid cell lines (LCLs) derived from children with autistic disorder (AD) after 48 h incubation with 1 mM of N-acetyl-cysteine (NAC) as compared with control LCLs at baseline and after exposure to the redox cycling agent 2,3-dimethoxy-1,4-napthoquinone (DMNQ) at four concentrations (5, 10, 12.5 and 15 μM) one hour before the assay. Overall, atypical changes in mitochondrial function with increased DMNQ seen in the AD-A subgroup (eh) are rescued with NAC treatment whereas NAC does not alter the dynamics of mitochondrial function in the AD-N subgroup (ad). For the AD-N subgroup (a) adenosine-5'-triphosphate(atp)-linked respiration, (b) proton-leak respiration, (c) maximum respiratory capacity and (d) reserve capacity are similar between the AD and control LCLs. For the AD-A subgroup, changes (e) ATP-linked respiration, (f) proton-leak respiration, (g) maximum respiratory capacity and (h) reserve capacity with increasing DMNQ did not differ between the AD-A and control LCLs. However, (e) ATP-linked respiration, (f) proton-leak respiration and (g) maximum respiratory capacity were found to be overall greater in the AD-A LCLs as compared with control LCLs. This change in the overall function of the AD-A LCLs with NAC pretreatment normalized the reserve capacity differences between the AD-A and control LCLs.

References

    1. American Psychiatric Association Diagnostic and Statistical Manual of Mental Disorders,4th edn. American Psychiatric Association: Washington, DC, USA; 1994
    1. Autism and Developmental Disabilities Monitoring Network Surveillance Year Principal Investigators, Centers for Disease Control and Prevention Prevalence of autism spectrum disorders—Autism and Developmental Disabilities Monitoring Network, United States, 2006. MMWR Surveill Summ. 2009;58:1–20. - PubMed
    1. Rossignol DA, Frye RE. Mitochondrial dysfunction in autism spectrum disorders: a systematic review and meta-analysis. Mol Psychiatry. 2012;17:290–314. - PMC - PubMed
    1. Fowler BA, Woods JS. Ultrastructural and biochemical changes in renal mitochondria during chronic oral methyl mercury exposure: the relationship to renal function. Exp Mol Pathol. 1977;27:403–412. - PubMed
    1. Shenker BJ, Guo TL, O I, Shapiro IM. Induction of apoptosis in human T-cells by methyl mercury: temporal relationship between mitochondrial dysfunction and loss of reductive reserve. Toxicol Appl Pharmacol. 1999;157:23–35. - PubMed

Publication types