. 2014 Apr 1;9(4):e91127.
doi: 10.1371/journal.pone.0091127. eCollection 2014.

Altered lipid homeostasis in Sertoli cells stressed by mild hyperthermia

Affiliations

Altered lipid homeostasis in Sertoli cells stressed by mild hyperthermia

Ana S Vallés et al. PLoS One. .

Abstract

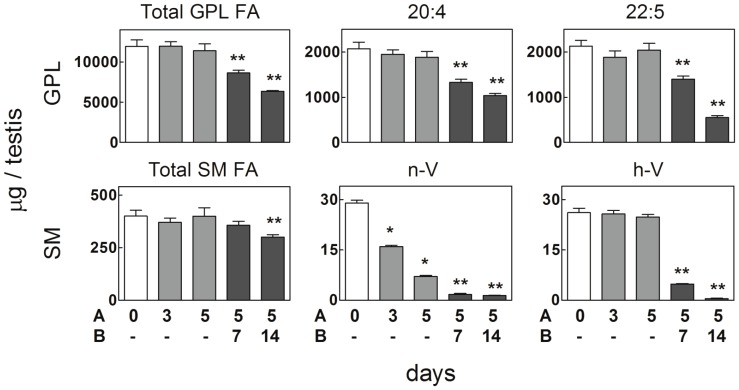
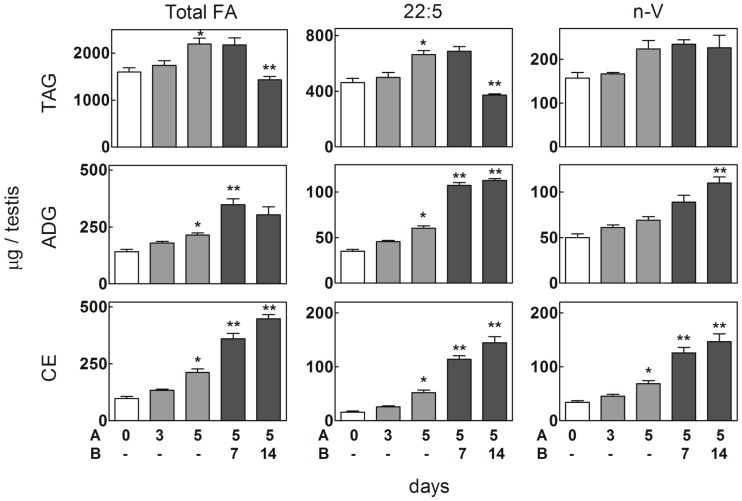
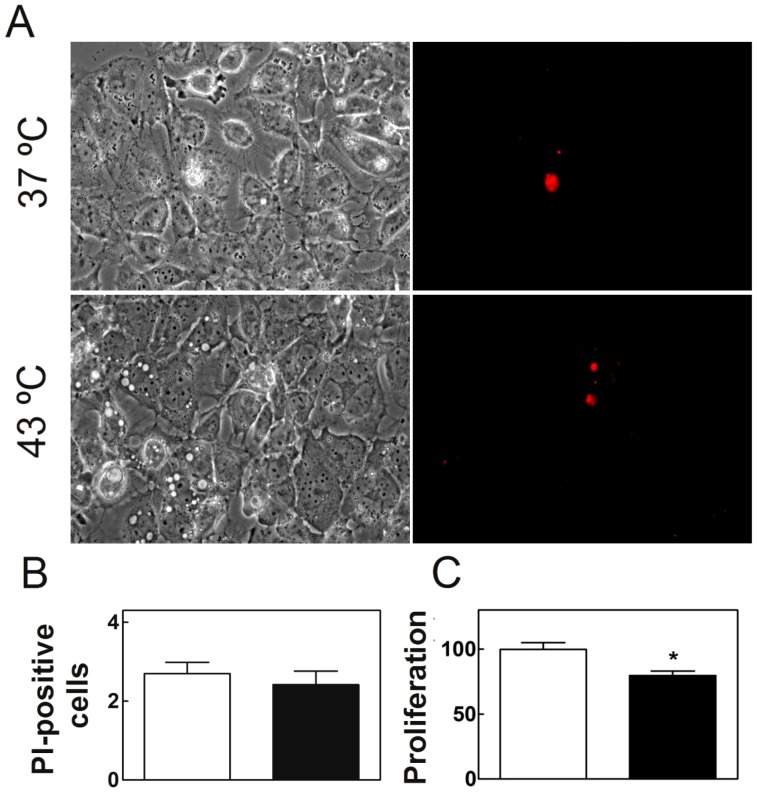
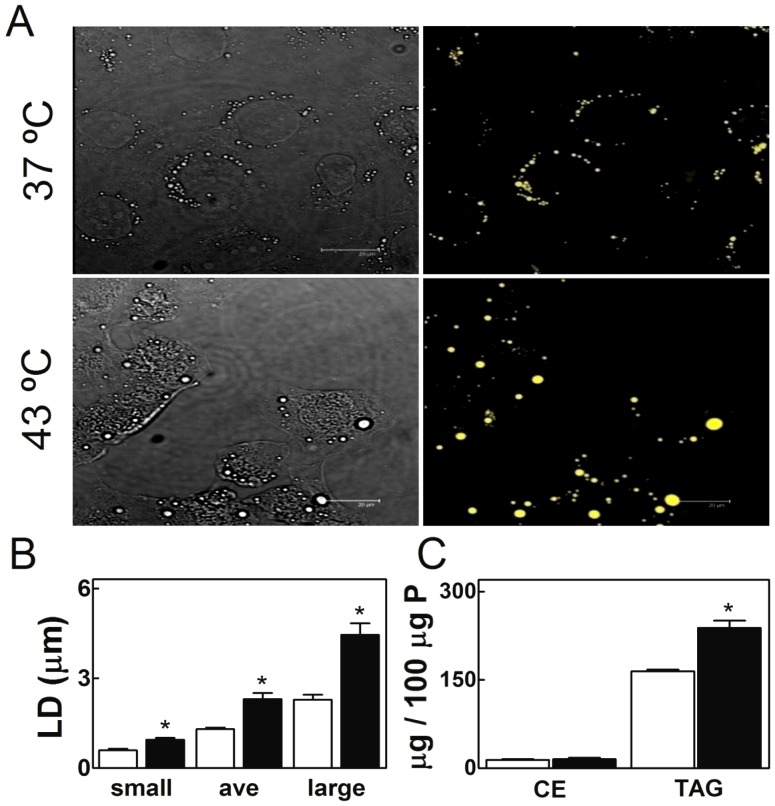
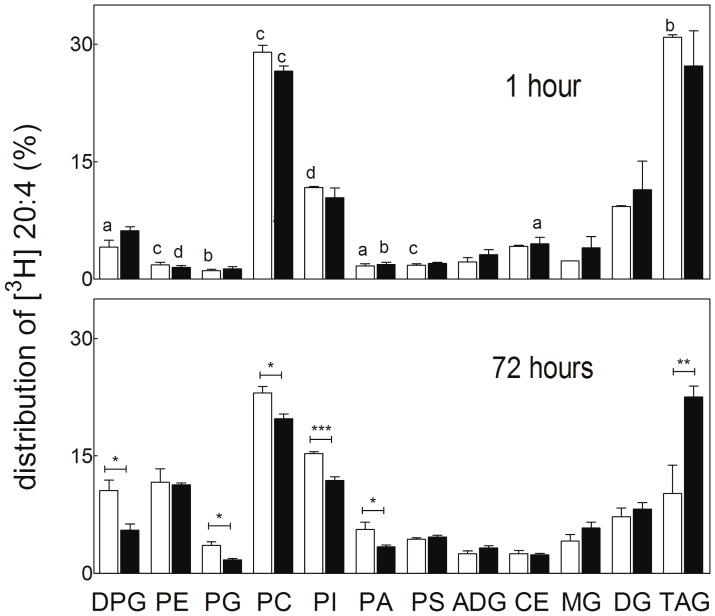
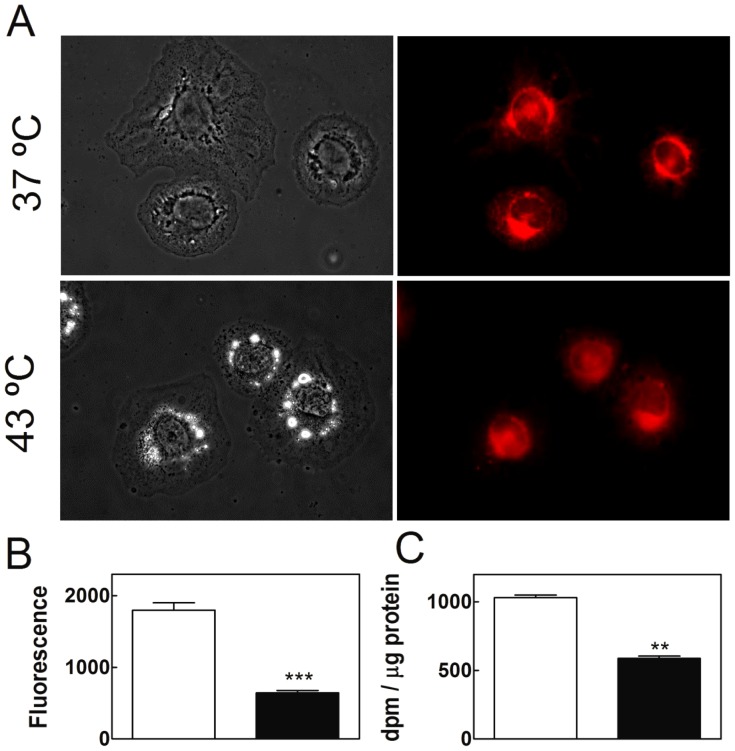
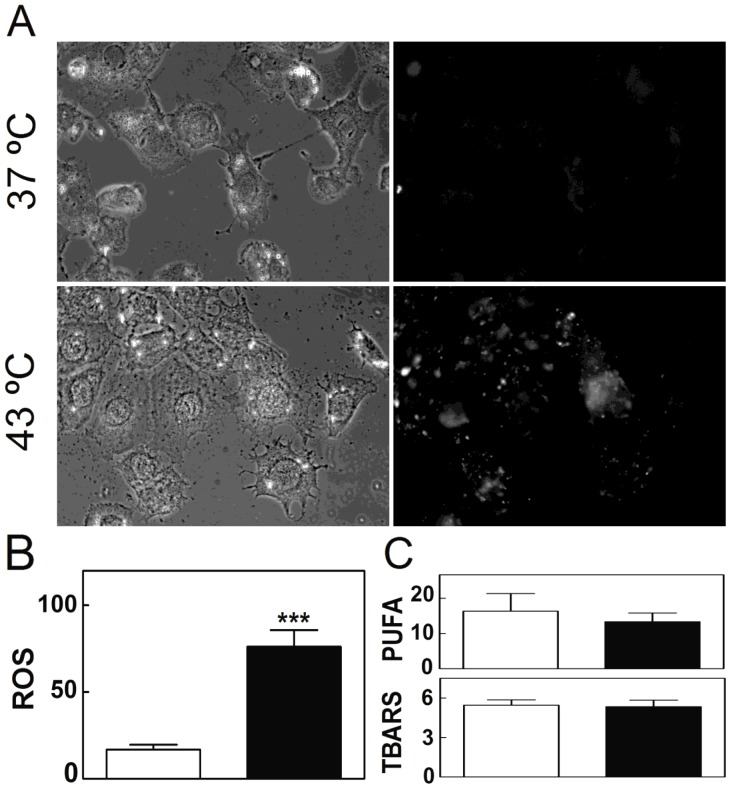
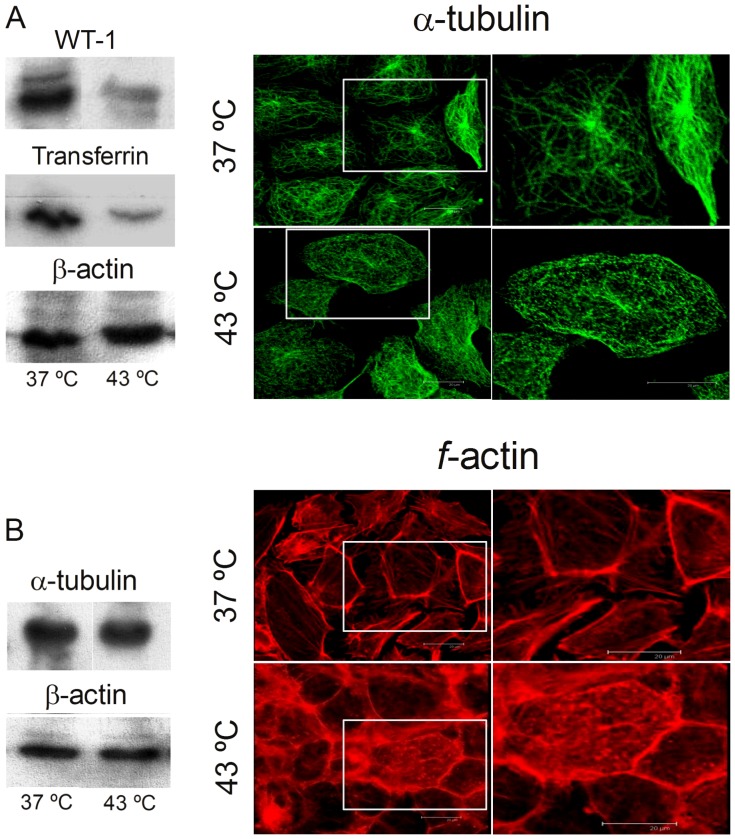
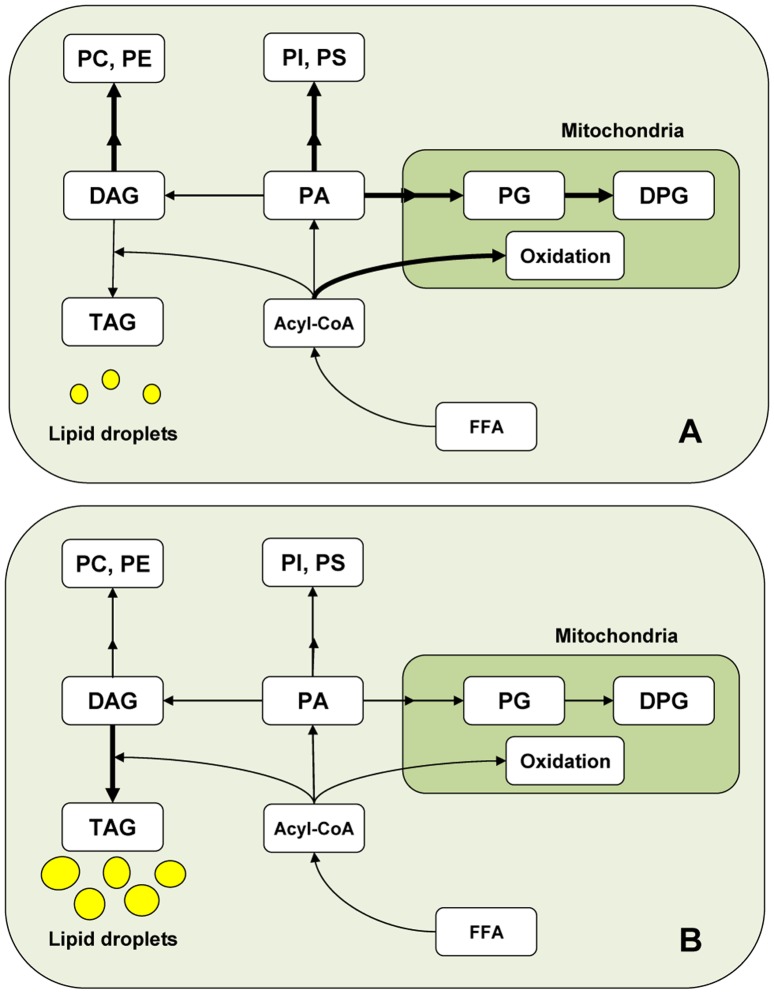
Spermatogenesis is known to be vulnerable to temperature. Exposures of rat testis to moderate hyperthermia result in loss of germ cells with survival of Sertoli cells (SC). Because SC provide structural and metabolic support to germ cells, our aim was to test the hypothesis that these exposures affect SC functions, thus contributing to germ cell damage. In vivo, regularly repeated exposures (one of 15 min per day, once a day during 5 days) of rat testes to 43 °C led to accumulation of neutral lipids. This SC-specific lipid function took 1-2 weeks after the last of these exposures to be maximal. In cultured SC, similar daily exposures for 15 min to 43 °C resulted in significant increase in triacylglycerol levels and accumulation of lipid droplets. After incubations with [3H]arachidonate, the labeling of cardiolipin decreased more than that of other lipid classes. Another specifically mitochondrial lipid metabolic function, fatty acid oxidation, also declined. These lipid changes suggested that temperature affects SC mitochondrial physiology, which was confirmed by significantly increased degrees of membrane depolarization and ROS production. This concurred with reduced expression of two SC-specific proteins, transferrin, and Wilms' Tumor 1 protein, markers of SC secretion and differentiation functions, respectively, and with an intense SC cytoskeletal perturbation, evident by loss of microtubule network (α-tubulin) and microfilament (f-actin) organization. Albeit temporary and potentially reversible, hyperthermia-induced SC structural and metabolic alterations may be long-lasting and/or extensive enough to respond for the decreased survival of the germ cells they normally foster.


Conflict of interest statement

Competing Interests: The authors have declared that no competing interests exist.

Figures

Figure 1
Figure 1. In vivo effects of hyperthermia on fatty acid levels of glycerophospholipids (GPL) and sphingomyelins (SM) of rat testis.
One single 15°C per day was applied to rat testes for 3 or 5 consecutive days (indicated in A). After the 5th of these 15 min hyperthermia events, the animals were returned to their normal habitat for 7 and 14 days (indicated in B). Samples were obtained from controls (white bars), from animals on the same day of the last hyperthermia treatment (grey bars), and at the end of the described periods with no further treatments (black bars). Asterisks: one (*), points to significant differences with respect to controls; two (**), point to significant differences with respect to day 5.
Figure 2
Figure 2. In vivo effects of hyperthermia on fatty acid levels of triacylglycerol (TAG), alkyl/alkenyl diacylglycerol (ADG), and cholesteryl ester (CE) in rat testis.
As described in Figure 1, one single 15 min exposure per day was applied to rat testes for 3 or 5 consecutive days (indicated in A). After the 5th of these hyperthermia events, the animals were returned to their normal habitat for 7 and 14 days (indicated in B). Samples were obtained from controls (white bars), from animals on the same day of the last hyperthermia treatment (grey bars), and at the end of the described periods (black bars). Other details as in Figure 1.
Figure 3
Figure 3. Effects of hyperthermia on SC viability.
Cells cultured at 37°C and cells cultured similarly at 37°C but exposed once a day for 15 min to 43°C, both during five days, are compared. A) Phase contrast (left) and fluorescence images (right) of propidium iodide (PI)-positive TM4 cell nuclei. B) Quantification of dead cells after control (white bars) and hyperthermia treatments (black bars), as reported by the labeling with PI (% of dead cells with respect to total cells in each condition). C) Viability of the cells, as evaluated by their capacity to reduce the MTT reagent (% of live cells in each condition) (*p<0.05).
Figure 4
Figure 4. Effects of hyperthermia on SC lipid droplet number and size, and correlation with triacylglycerol (TAG) content.
Cells cultured at 37°C and cells cultured similarly but exposed once a day for 15 min to 43°C, both during five days, are compared. A) Phase contrast (left) and fluorescence images (right) of TM4 cells stained with Nile Red to mark lipid droplets. B) Comparison of lipid droplet diameter, and relative abundance of small, average (ave), and large diameter lipid droplets in control (white bars) and experimental (black bars) cells. C) Content of cholesteryl esters (CE) and TAG in these two conditions. (*p<0.05).
Figure 5
Figure 5. Effects of hyperthermia on the distribution (%) of [3H] arachidonic acid (AA) among TM4 cell lipids.
Control cells cultured for 5 days at 37°C (white bars) and cells similarly cultured but exposed once a day for 15 min to 43°C (black bars) are compared. After these exposures, the cells were incubated for 1 hour with [3H] AA. The medium was removed, the cells were washed, and samples were immediately obtained (indicated as 1 hour) for lipid analysis. The rest of the washed cells were cultured for a further period of 3 days (indicated as 72 hours), in both cases at 37°C, lipids being obtained at the end of this period. Statistically significant differences associated to incubation time (1 hour versus 72 hours) at each temperature condition, are indicated by letters. Differences associated to temperature conditions (previous exposures to 37°C versus 43°C) at each incubation time are indicated with asterisks (*p<0.01; **p<0.008; ***p<0.0005; (a) p<0.030; (b) p<0.008; (c) p<0.005; (d) p<0.0001).
Figure 6
Figure 6. Effects of hyperthermia on mitochondrial functionality.
TM4 cells cultured at 37°C and cells cultured similarly but exposed once a day for 15 min to 43°C, both during five days, are compared. A) Phase contrast (left) and fluorescence (right) images of TM4 cells treated with the red-fluorescent dye MitoTracker Red CMXROS. B) Quantification of the fluorescence intensity per cell (expressed on the same basis, as arbitrary units) in control and experimental cells (white and black bars, respectively). C) [3H]-labeled aqueous products from cell incubation media from the cells whose lipids had been pre-labeled with [3H] AA for 1 hour and then kept in culture for 72 further hours as detailed in Figure 5. (**p<0.002; ***p<0.0001).
Figure 7
Figure 7. Effects of hyperthermia on SC oxidative stress.
Cells cultured for 5 days at 37°C and cells cultured similarly but exposed once a day for 15 min to 43°C, are compared. A) Phase contrast (left) and fluorescence (right) images of TM4 cells treated with the probe DCDCDHF to monitor the oxidative status. B) Reactive oxigen species (ROS), as quantified from the average intensity of the fluorescent emission per cell in control (white bars) and experimental (black bars) conditions. Results are expressed on the same basis, as arbitrary units (*p<0.03; ***p<0.0001). C) Upper panel: percentage of long-chain PUFA in the total lipid of cells; lower panel: absorbance of TBA reactive substances (TBARS), produced by cells exposed to the same conditions.
Figure 8
Figure 8. Effects of hyperthermia on specific functional and structural SC proteins.
The depicted proteins were obtained from cells cultured for 5 days at 37°C and from cells cultured similarly but exposed once a day for 15 min to 43°C. A) Intensities of the WT1 and transferrin bands, as normalized with respect to the intensity of β-actin. B) β-actin and α-tubulin levels, as normalized with respect to total cell protein. C) Effects of the repeated brief exposures to 43°C, on α-tubulin microtubules and f-actin networks, as observed by confocal microscopy. The areas indicated by the white rectangles are shown enlarged on the right panels.
Figure 9
Figure 9. Pathways of lipid labeling, as modified by temperature exposures.
A) Cells cultured at 37°C. B) Cells cultured at 37°C but exposed once a day for 15 min to 43°C, in both cases for 5 consecutive days. Double arrows indicate that more than one enzymatic steps and lipid intermediates are involved. The fatty acids that were not used for lipid synthesis and fatty acid oxidation in temperature-stressed cells would be collected in the form of TAG, main components of the increased lipid droplets.

References

    1. Moore CR (1924) The behavior of the germinal epithelium in testis grafts and in experimental cryptorchid testes (rat and guinea pig). Science 59: 41–44. - PubMed
    1. Setchell BP (1998) The Parkes Lecture. Heat and the testis. J Reprod Fertil 114: 179–194. - PubMed
    1. Yamamoto CM, Sinha Hikim AP, Huynh PN, Shapiro B, Lue Y, et al. (2000) Redistribution of Bax is an early step in an apoptotic pathway leading to germ cell death in rats, triggered by mild testicular hyperthermia. Biol Reprod 63: 1683–1690. - PubMed
    1. Rockett JC, Mapp FL, Garges JB, Luft JC, Mori C, et al. (2001) Effects of hyperthermia on spermatogenesis, apoptosis, gene expression, and fertility in adult male mice. Biol Reprod 65: 229–239. - PubMed
    1. Sinha Hikim AP, Swerdloff RS (1999) Hormonal and genetic control of germ cell apoptosis in the testis. Rev Reprod 4: 38–47. - PubMed

Publication types

LinkOut - more resources