

Poverty, disease, and the ecology of complex systems
- PMID: 24690902
- PMCID: PMC3972083
- DOI: 10.1371/journal.pbio.1001827
Poverty, disease, and the ecology of complex systems
Abstract
Understanding why some human populations remain persistently poor remains a significant challenge for both the social and natural sciences. The extremely poor are generally reliant on their immediate natural resource base for subsistence and suffer high rates of mortality due to parasitic and infectious diseases. Economists have developed a range of models to explain persistent poverty, often characterized as poverty traps, but these rarely account for complex biophysical processes. In this Essay, we argue that by coupling insights from ecology and economics, we can begin to model and understand the complex dynamics that underlie the generation and maintenance of poverty traps, which can then be used to inform analyses and possible intervention policies. To illustrate the utility of this approach, we present a simple coupled model of infectious diseases and economic growth, where poverty traps emerge from nonlinear relationships determined by the number of pathogens in the system. These nonlinearities are comparable to those often incorporated into poverty trap models in the economics literature, but, importantly, here the mechanism is anchored in core ecological principles. Coupled models of this sort could be usefully developed in many economically important biophysical systems--such as agriculture, fisheries, nutrition, and land use change--to serve as foundations for deeper explorations of how fundamental ecological processes influence structural poverty and economic development.
Conflict of interest statement
The authors have declared that no competing interests exist.
Figures
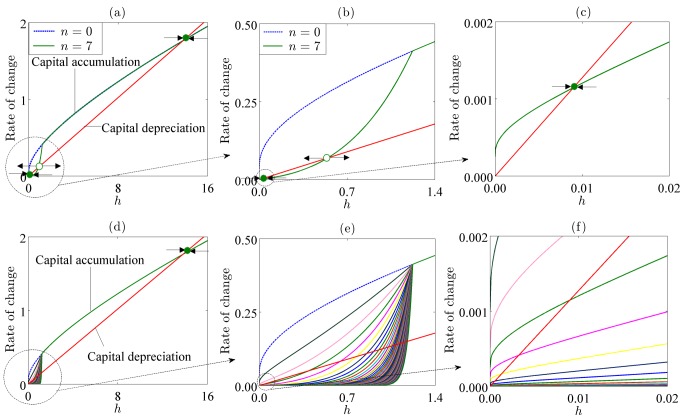
 (dashed blue line) and
  (solid dark green line). Graph (b) is a magnified version of the initial portion of graph (a), while graph (c) is a magnified version of the initial portion of graph (b) showing a stable positive poverty trap. The filled circles denote stable equilibria while the open circle denotes an unstable equilibrium. Graph (e) is a magnified version of the initial portion of graph (d), while graph (f) is a magnified version of the initial portion of graph (e). Each curve in graphs (d–f) represents the structure of capital accumulation for different numbers of pathogens.
References
-
- Malthus TR (1798) An essay on the principle of population. London: W. Pickering, 1986.
-
- Azariadis C, Stachurski J (2005) Poverty traps. Handbook of Economic Growth 1: 295–384.
-
- Bowles S, Durlauf S, Hoff K (2006) Poverty traps. Princeton: Princeton University Press.
-
- Verhulst PF (1838) Notice sur la loi que la population pursuit dans son accroissement. Correspondance Mathématique et Physique 10: 113–121.
Publication types
MeSH terms
Grants and funding
LinkOut - more resources
Full Text Sources
Other Literature Sources
