. 2014 Jul;64(1):87-99.
doi: 10.1097/FJC.0000000000000094.

An omega-3 epoxide of docosahexaenoic acid lowers blood pressure in angiotensin-II-dependent hypertension

Affiliations

An omega-3 epoxide of docosahexaenoic acid lowers blood pressure in angiotensin-II-dependent hypertension

Arzu Ulu et al. J Cardiovasc Pharmacol. 2014 Jul.

Abstract

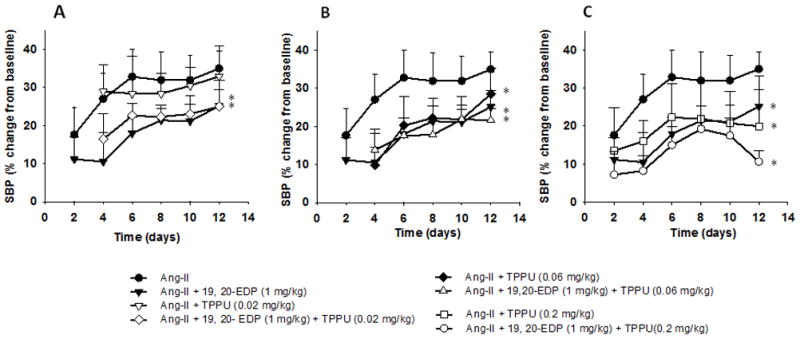
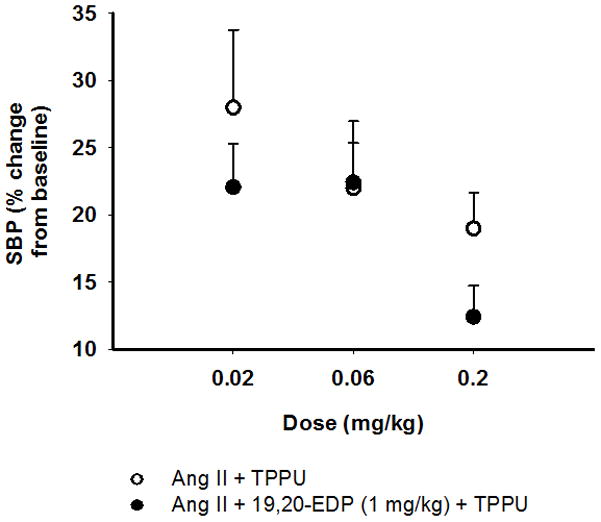
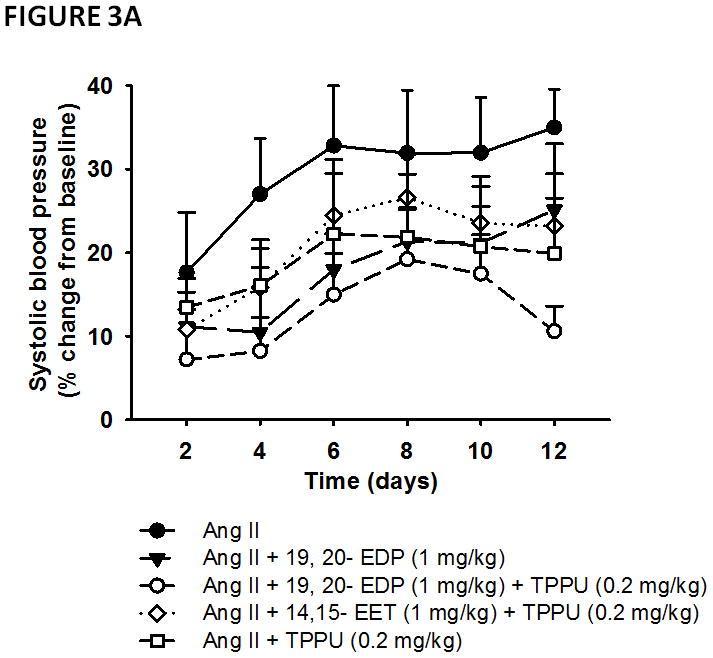
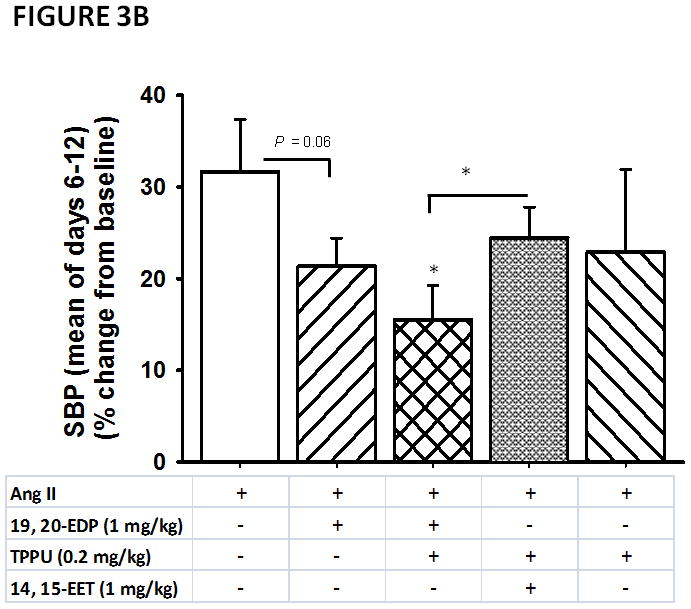
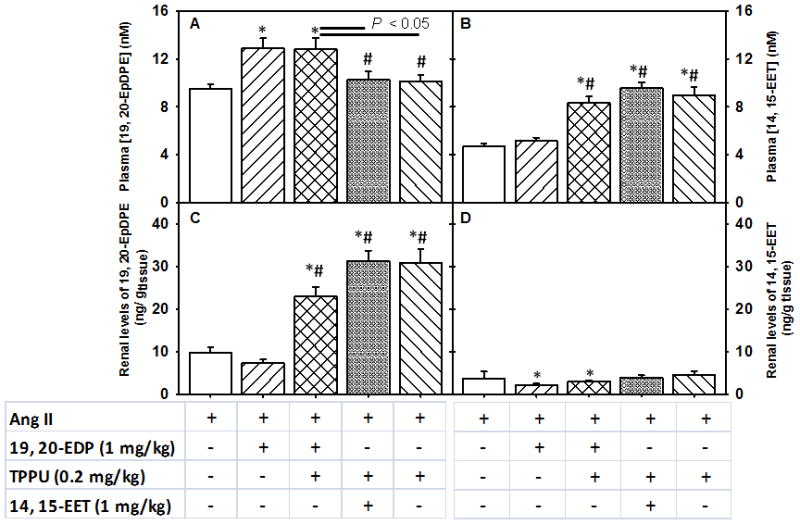
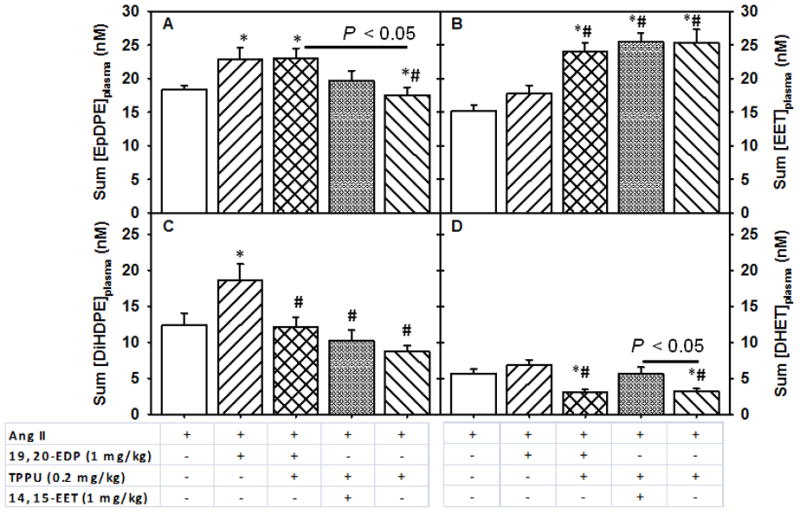
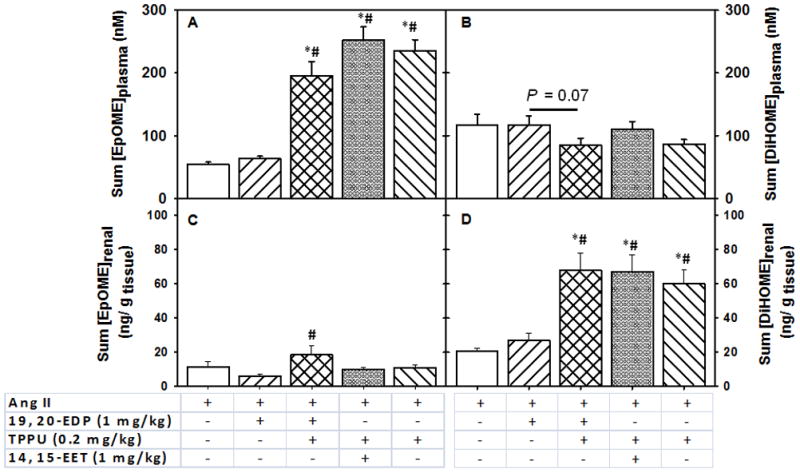
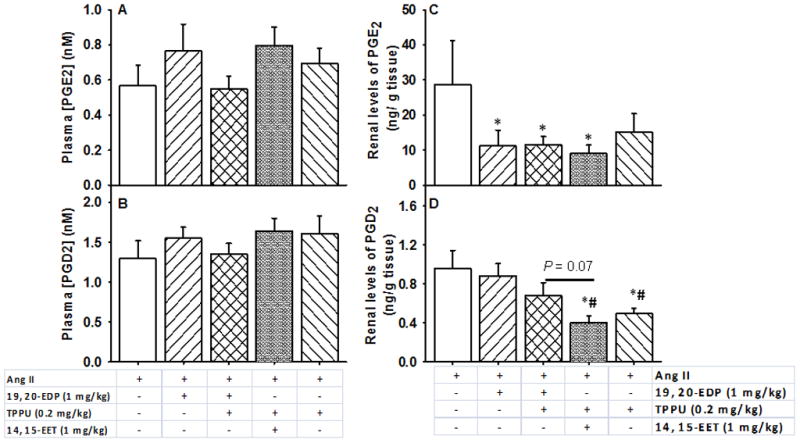
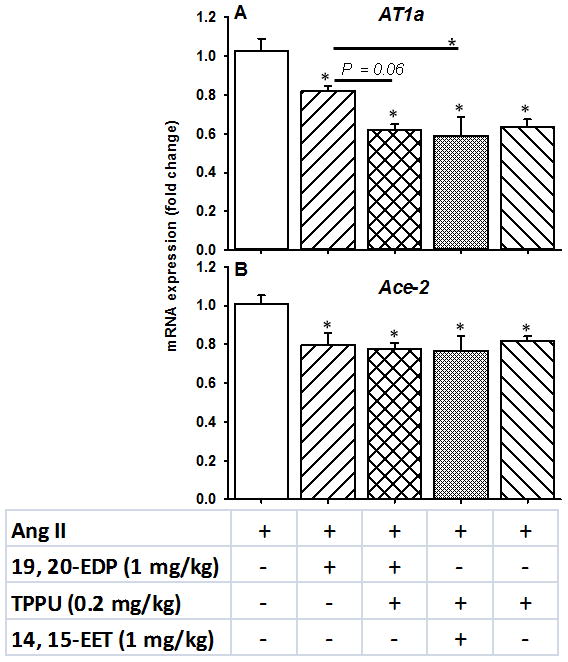
Mediators of antihypertensive actions of docosahexaenoic acid (DHA) are largely unknown. The omega-3 epoxide of DHA, 19, 20-EDP (epoxy docosapentaenoic acid), is metabolized by soluble epoxide hydrolase (sEH), which also metabolizes the anti-inflammatory and antihypertensive arachidonic acid epoxides, epoxyeicosatrienoic acids (EETs). Based in part on plasma levels of EDPs after a DHA-rich diet, we hypothesized that 19, 20-EDP contributes to the antihypertensive actions of DHA in angiotensin-II (Ang-II)-dependent hypertension. Treatment individually with 19, 20-EDP and a potent sEH inhibitor TPPU (1-trifluoromethoxyphenyl-3-(1-propionylpiperidin-4-yl) urea) significantly lowered blood pressure (BP) as compared with Ang-II-infused animals. The largest reduction in BP was obtained with the combination of 19, 20-EDP and TPPU, which was more efficacious than the combination of 14, 15-EET and TPPU. Oxylipin profiling revealed that 19, 20-EDP and 14, 15-EET infusion affected not only most metabolites of the P450 pathway but also renal levels of prostaglandin-E2. Our findings suggest that 19, 20-EDP is a mediator of the antihypertensive effects of DHA in Ang-II-dependent hypertension. It seems that 19, 20-EDP requires metabolic stabilization with a sEH inhibitor to be most effective in lowering BP, although both TPPU and 19, 20-EDP are so effective on their own that demonstrating additive or synergistic interactions is difficult.


Figures

FIGURE 1
FIGURE 1
Comparison of the blood pressure-time course of Ang II infused animals and those treated with: A. 19, 20- EDP alone, TPPU alone (0.02 mg/kg) and combination of 19, 20-EDP and TPPU at 0.02 mg/kg dose, B. 19, 20- EDP alone, TPPU alone (0.06 mg/kg) and the combination of 19, 20-EDP and TPPU at 0.06 mg/kg dose, C. 19, 20- EDP alone, TPPU alone (0.2 mg/kg) and the combination of 19, 20-EDP and TPPU at 0.2 mg/kg dose. Data are mean ± SEM. Error bars are only shown unidirectional. Ang II alone, n= 6–8; Ang II + 19, 20- EDP, n= 8–9; Ang-II + TPPU (0.02 mg/kg), n = 7–9, Ang-II + 19, 20-EDP + TPPU (0.02 mg/kg), n = 6, Ang-II + TPPU (0.06 mg/kg), n = 8; Ang-II + 19, 20-EDP + TPPU (0.06 mg/kg), n = 9–10; Ang II + TPPU (0.2 mg/kg), n= 4–6, Ang II + 19, 20- EDP + TPPU (0.2 mg/kg), n= 7–9. The asterisk indicates a statistically significant difference in SBP between treatment groups (TPPU, 19, 20-EDP or the combination) and the Ang-II infused animals.
FIGURE 2
FIGURE 2
Dose- response relationship associated with the sEH inhibitor TPPU and 19, 20-EDP in Ang II dependent hypertension. Data are mean ± SEM. Error bars are only shown unidirectional.
FIGURE 3
FIGURE 3
Anti-hypertensive effects of 19, 20- EDP and 14, 15- EET in angiotensin-II dependent hypertension. A. Systolic blood pressure (SBP) is shown as percent change from baseline. Blood pressure readings commenced with initiation of Ang II infusion. TPPU was administered in drinking water at a 0.2 mg/kg dose each day for five days before the induction of hypertension by Ang II. B. Marginal group means of days 6–12 are shown. Statistically significant differences (P < 0.05) are indicated with an asterisk as compared to Ang II infused animals. Data are mean ± SEM. Ang II alone, n=6–8; Ang II + 19, 20- EDP, n= 8–9; Ang II + 19, 20- EDP + TPPU (0.2 mg/kg), n=7–9; Ang II + 14, 15- EET + TPPU (0.2 mg/kg), n= 6–8; Ang II + TPPU (0.2 mg/kg), n= 4–6, Ang-II + 19, 20-EDP + TPPU (0.02 mg/kg), n =6, Ang-II + 19, 20-EDP + TPPU (0.06 mg/kg), n =9. The symbol (*) on Panel B indicates P < 0.05 as compared to all other groups. Differences in SBP between Ang II infused animals and other treatment groups are indicated with an asterisk.
FIGURE 3
FIGURE 3
Anti-hypertensive effects of 19, 20- EDP and 14, 15- EET in angiotensin-II dependent hypertension. A. Systolic blood pressure (SBP) is shown as percent change from baseline. Blood pressure readings commenced with initiation of Ang II infusion. TPPU was administered in drinking water at a 0.2 mg/kg dose each day for five days before the induction of hypertension by Ang II. B. Marginal group means of days 6–12 are shown. Statistically significant differences (P < 0.05) are indicated with an asterisk as compared to Ang II infused animals. Data are mean ± SEM. Ang II alone, n=6–8; Ang II + 19, 20- EDP, n= 8–9; Ang II + 19, 20- EDP + TPPU (0.2 mg/kg), n=7–9; Ang II + 14, 15- EET + TPPU (0.2 mg/kg), n= 6–8; Ang II + TPPU (0.2 mg/kg), n= 4–6, Ang-II + 19, 20-EDP + TPPU (0.02 mg/kg), n =6, Ang-II + 19, 20-EDP + TPPU (0.06 mg/kg), n =9. The symbol (*) on Panel B indicates P < 0.05 as compared to all other groups. Differences in SBP between Ang II infused animals and other treatment groups are indicated with an asterisk.
FIGURE 4
FIGURE 4
Plasma and renal levels of 19, 20- EDP and 14, 15-EET upon subcutaneous infusion of EpFAs in angiotensin-II dependent hypertension. Plasma and renal levels are shown in separate Panels. Panel A. Plasma concentration of 19, 20-EDP, Panel B. Plasma concentration of 14, 15- EET, Panel C. Renal levels of 19, 20-EDP and Panel D. Renal levels of 14, 15- EET. Statistically significant differences were determined by one-way ANOVA followed by pairwise comparisons. P < 0.05, *compared with Ang II animals, #compared with Ang II + 19, 20- EDP animals. Ang II, n=8; Ang II + 19, 20- EDP, n= 9; Ang II + 19, 20- EDP + TPPU, n=10; Ang II + 14, 15- EET + TPPU, n= 9; Ang II + TPPU, n= 9. Data are mean ± SEM.
FIGURE 5
FIGURE 5
Changes in plasma levels of summed EDPs and EETs and their corresponding diols upon subcutaneous infusion of EpFAs in angiotensin-II dependent hypertension. Summed plasma concentrations of Panel A. EDPs, which includes 10, 11-, 13, 14-, 14, 15- and 19,20-EDP, Panel B. EETs, which include 8, 9-, 11, 12- and 14, 15-EET, Panel C. DiHDPEs, which includes 10, 11-, 13, 14-, 14, 15- and 19,20-DiHDPE and Panel D. DHETs, which include 8, 9-, 11, 12- and 14, 15-DHETs. Statistically significant differences were analyzed by one-way ANOVA followed by pairwise comparisons. P < 0.05, *compared with Ang II animals, #compared with Ang II + EDP animals. Ang II, n=8; Ang II + 19, 20- EDP, n= 9; Ang II + 19, 20- EDP + TPPU, n=10; Ang II + 14, 15- EET + TPPU, n= 9; Ang II + TPPU, n= 9. Data are mean ± SEM.
FIGURE 6
FIGURE 6
Changes in the summed linoleic acid P450 and sEH metabolites in the plasma and kidney upon subcutaneous infusion of EpFAs in angiotensin-II dependent hypertension. Summed EpOMEs include 9, 10- EpOME and 12, 13- EpOME, and summed DiHOMEs include 9, 10- DiHOME and 12, 13- DiHOME. Summed plasma concentrations of Panel A. EpOMEs, Panel B. DiHOMEs, and summed renal levels of Panel C. EpOMEs, Panel D. DiHOMEs. Statistically significant differences were analyzed by one-way ANOVA followed by pairwise comparisons. P < 0.05, *compared with Ang II animals, #compared with Ang II + 19, 20- EDP animals. Ang II, n=8; Ang II + 19, 20- EDP, n= 9; Ang II + 19, 20- EDP + TPPU, n=10; Ang II + 14, 15- EET + TPPU, n= 9; Ang II + TPPU, n= 9. Data are mean ± SEM.
FIGURE 7
FIGURE 7
Effects of 19, 20- EDP and 14, 15-EET on plasma and renal prostaglandins. Plasma concentrations of A. PGE2, B. PGD2 and renal levels of C. PGE2, D. PGD2 are shown. Statistically significant differences were determined by one-way ANOVA followed by pairwise comparisons. P < 0.05, *compared with Ang II animals, #compared with Ang II + 19, 20- EDP animals. Ang II, n=8; Ang II + 19, 20- EDP, n= 9; Ang II + 19, 20- EDP + TPPU, n=10; Ang II + 14, 15- EET + TPPU, n= 9; Ang II + TPPU, n= 9. Data are mean ± SEM.
FIGURE 8
FIGURE 8
Changes in the renal mRNA expression of the A. AT1a and B. Ace-2 of the renin-angiotensin-aldosterone system upon treatment with 19, 20-EDP, 14, 15-EET and TPPU. Statistically significant differences were determined by one-way ANOVA followed by pairwise group comparisons. P < 0.05, *compared with Ang II animals. Ang II, n=7; Ang II + 19, 20-EDP, n= 6; Ang II + 19, 20- EDP + TPPU, n=7; Ang II + 14, 15- EET + TPPU, n= 6; Ang II + TPPU, n= 6. Data are mean ± SEM.

References

    1. Cabo J, Alonso R, Mata P. Omega-3 fatty acids and blood pressure. Br J Nutr. 2012;107 (Suppl 2):S195–200. - PubMed
    1. Mori TA. Omega-3 fatty acids and hypertension in humans. Clin Exp Pharmacol Physiol. 2006;33(9):842–846. - PubMed
    1. Liu JC, Conklin SM, Manuck SB, Yao JK, Muldoon MF. Long-chain omega-3 Fatty acids and blood pressure. Am J Hypertens. 2011;24(10):1121–1126. - PMC - PubMed
    1. Calder PC. Mechanisms of action of (n-3) fatty acids. The Journal of nutrition. 2012;142(3):592S–599S. - PubMed
    1. Jump DB, Depner CM, Tripathy S. Omega-3 fatty acid supplementation and cardiovascular disease. J Lipid Res. 2012;53(12):2525–2545. - PMC - PubMed

Publication types