

Evaluation of high-resolution precipitation estimates from satellites during July 2012 Beijing flood event using dense rain gauge observations
- PMID: 24691358
- PMCID: PMC3972163
- DOI: 10.1371/journal.pone.0089681
Evaluation of high-resolution precipitation estimates from satellites during July 2012 Beijing flood event using dense rain gauge observations
Abstract
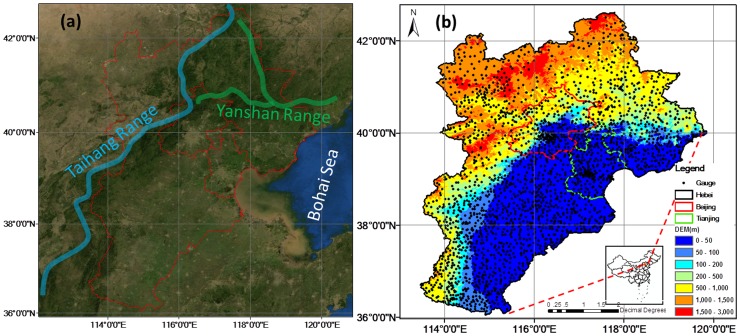
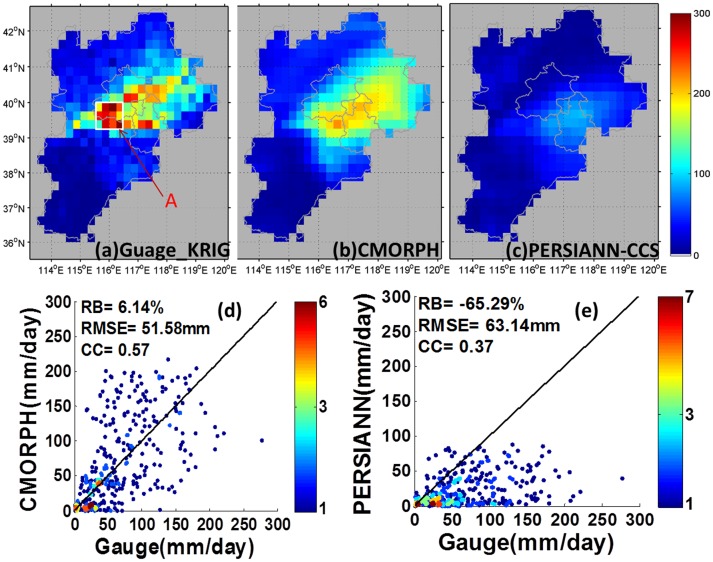
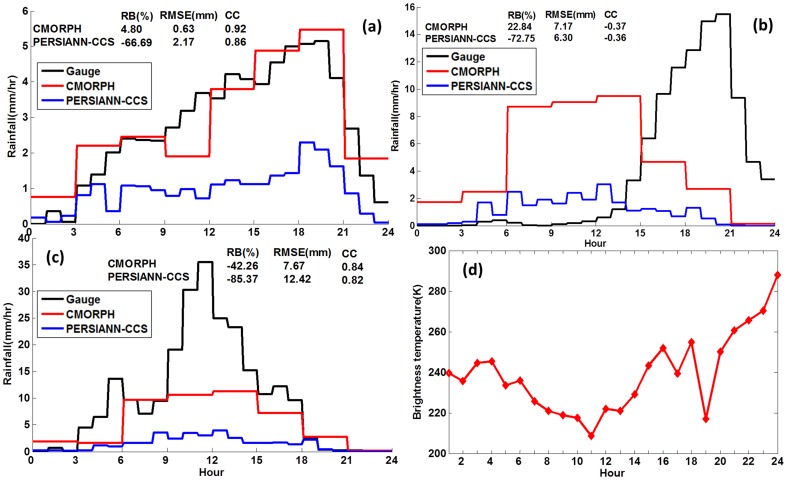
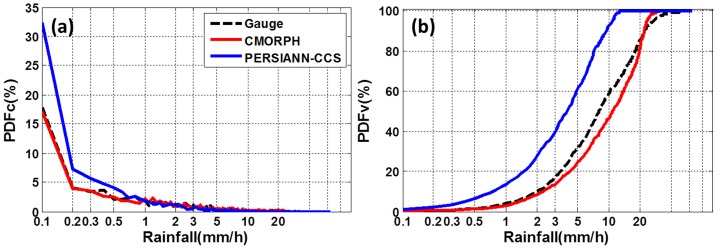
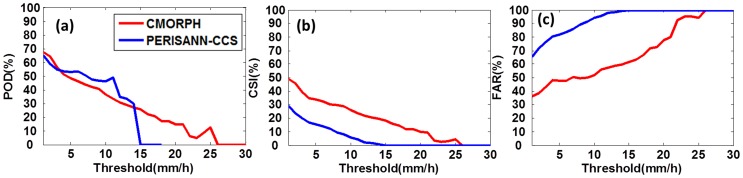
Satellite-based precipitation estimates products, CMORPH and PERSIANN-CCS, were evaluated with a dense rain gauge network over Beijing and adjacent regions for an extremely heavy precipitation event on July 21 2012. CMORPH and PEERSIANN-CSS misplaced the region of greatest rainfall accumulation, and failed to capture the spatial pattern of precipitation, evidenced by a low spatial correlation coefficient (CC). CMORPH overestimated the daily accumulated rainfall by 22.84% while PERSIANN-CCS underestimated by 72.75%. In the rainfall center, both CMORPH and PERSIANN-CCS failed to capture the temporal variation of the rainfall, and underestimated rainfall amounts by 43.43% and 87.26%, respectively. Based on our results, caution should be exercised when using CMORPH and PERSIANN-CCS as input for monitoring and forecasting floods in Beijing urban areas, and the potential for landslides in the mountainous zones west and north of Beijing.
Conflict of interest statement
Figures
References
-
- Zhang D-L, Lin Y, Zhao P, Yu X, Wang S, et al. (2013) The Beijing extreme rainfall of 21 July 2012: “Right results” but for wrong reasons. Geophysical Research Letters
-
- Wang K, Wang L, Wei Y-M, Ye M (2013) Beijing storm of July 21, 2012: observations and reflections. Natural Hazards 1–6.
-
- Grumm RH (2012) Beijing flood of 21 July 2012. Available: http://nws.met.psu.edu/severe/2012/21Jul2012.pdf. Accessed: 30 Nov 2012.
-
- Sang YF, Wang Z, Liu C (2012) What factors are responsible for the Beijing storm? Natural Hazards 1–2.
-
- Change IPOC (2007) Climate change 2007: The physical science basis. Agenda 6: 07.
Publication types
MeSH terms
LinkOut - more resources
Full Text Sources
Other Literature Sources
Medical
