. 2014 May;124(5):2125-35.
doi: 10.1172/JCI72619. Epub 2014 Apr 1.

Senescence-associated SIN3B promotes inflammation and pancreatic cancer progression

Senescence-associated SIN3B promotes inflammation and pancreatic cancer progression

Maïté Rielland et al. J Clin Invest. 2014 May.

Abstract

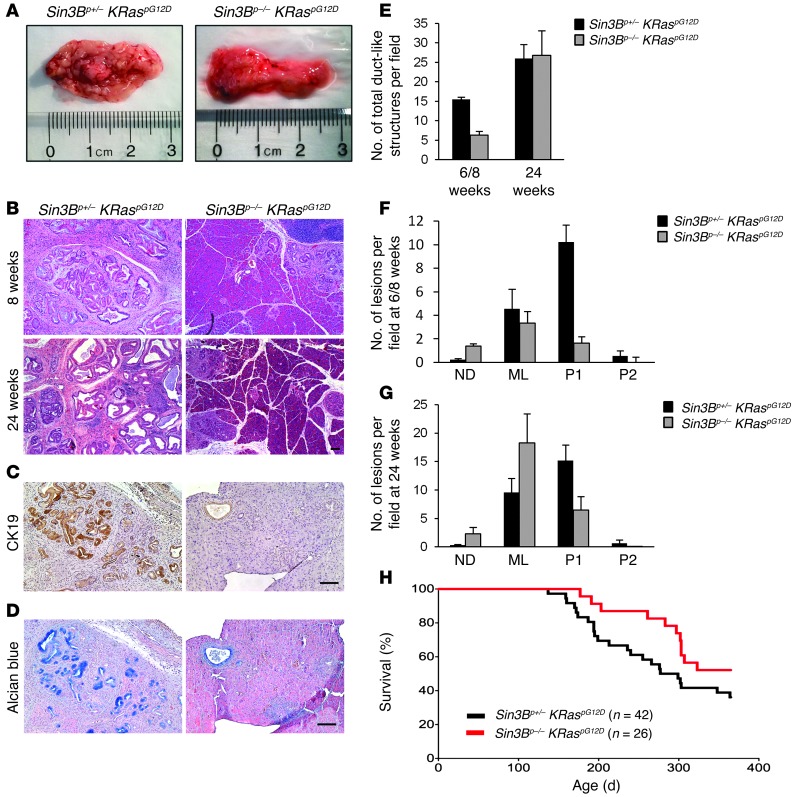
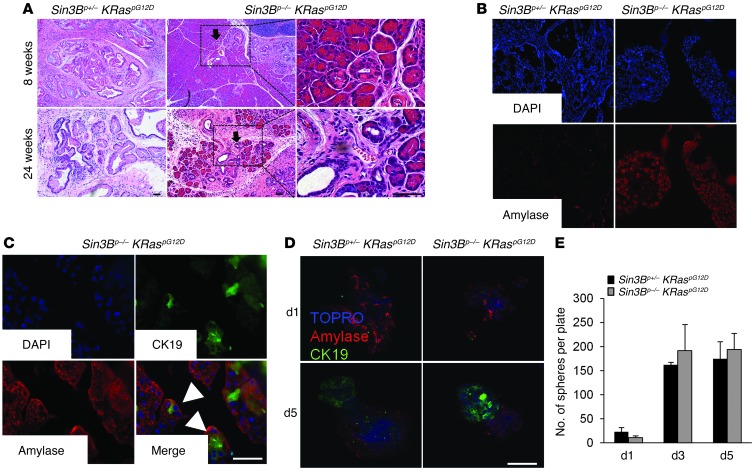
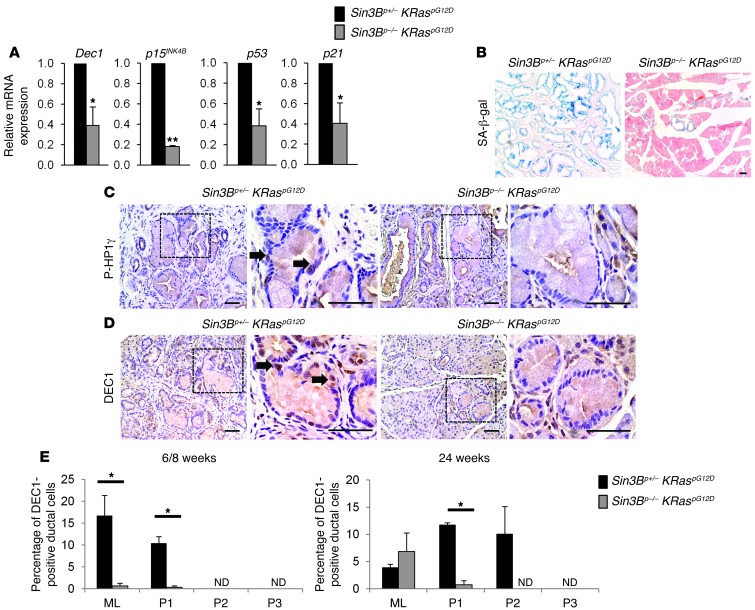
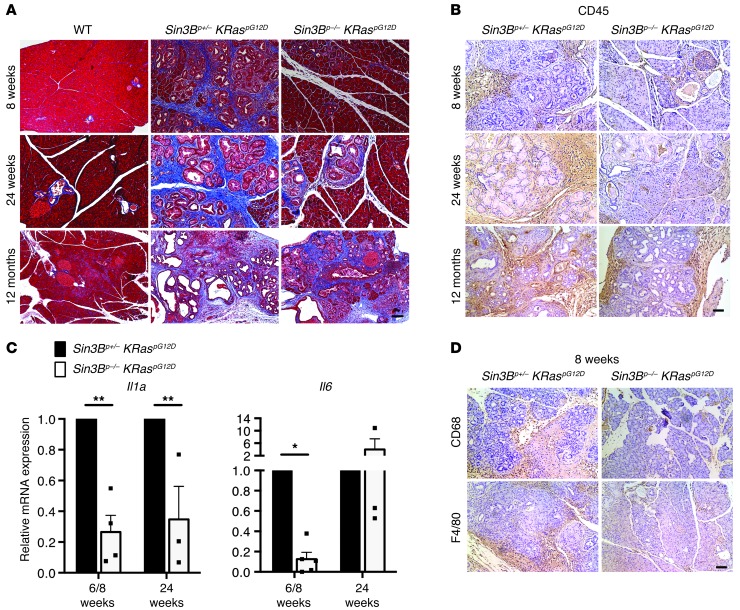
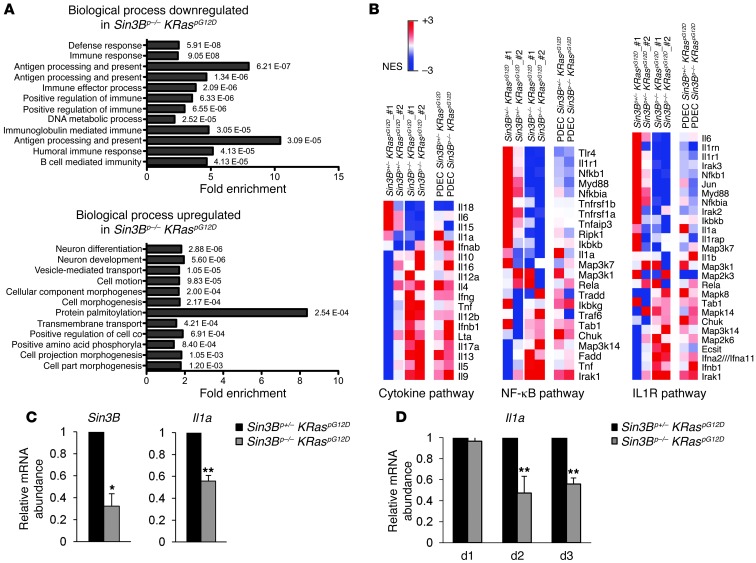
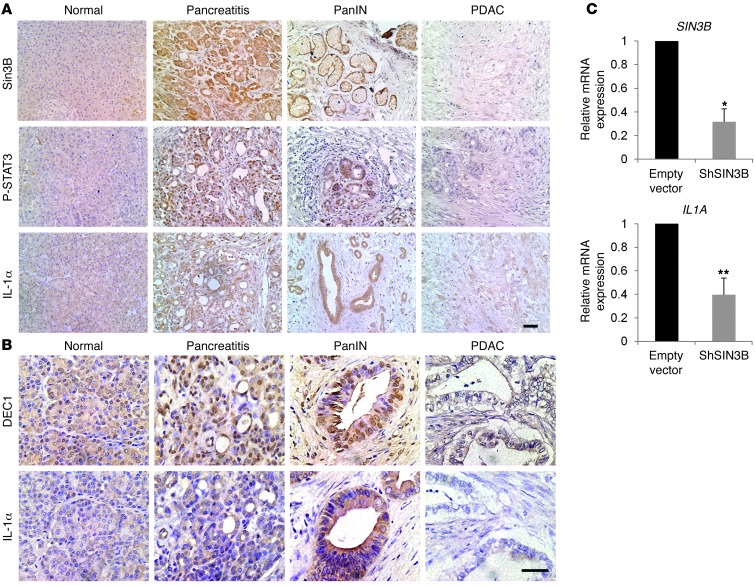
Pancreatic ductal adenocarcinoma (PDAC) is strikingly resistant to conventional therapeutic approaches. We previously demonstrated that the histone deacetylase-associated protein SIN3B is essential for oncogene-induced senescence in cultured cells. Here, using a mouse model of pancreatic cancer, we have demonstrated that SIN3B is required for activated KRAS-induced senescence in vivo. Surprisingly, impaired senescence as the result of genetic inactivation of Sin3B was associated with delayed PDAC progression and correlated with an impaired inflammatory response. In murine and human pancreatic cells and tissues, levels of SIN3B correlated with KRAS-induced production of IL-1α. Furthermore, evaluation of human pancreatic tissue and cancer cells revealed that Sin3B was decreased in control and PDAC samples, compared with samples from patients with pancreatic inflammation. These results indicate that senescence-associated inflammation positively correlates with PDAC progression and suggest that SIN3B has potential as a therapeutic target for inhibiting inflammation-driven tumorigenesis.


Figures

Figure 1
Figure 1. Genetic inactivation of Sin3B delays progression of KRASG12D-driven PanINs.
(A) Representative 6-month-old pancreata from Sin3Bp+/– KraspG12D and Sin3Bp–/– KraspG12D mice. (B) H&E staining in 8- and 24-week-old Sin3B+/ KraspG12D and Sin3Bp–/– KraspG12D pancreata. (C) Immunochemistry for CK19 in 8-week-old Sin3B+/– KraspG12D and Sin3Bp–/– KraspG12D pancreata. (D) Alcian blue staining for mucin in 8-week-old Sin3B+/– KraspG12D and Sin3Bp–/– KraspG12D pancreata. (E) Number of duct-like structures per field in 6- to 8-week-old (6/8 weeks) and 24-week-old pancreata. Black bars represent Sin3Bp+/– KraspG12D pancreas and gray bars represent Sin3Bp–/– KraspG12D pancreas. (F) Number of normal ducts (ND), metaplastic lesions (ML), PanIN1 (P1), PanIN2 (P2), and PanIN3 (P3) per field in 6- to 8-week-old mice. Black bars represent Sin3Bp+/– KraspG12D pancreas, and gray bars represent Sin3Bp–/– KraspG12D pancreas. (G) Number of normal ducts, metaplastic lesions, PanIN1, PanIN2, and PanIN3 per field in 24-week-old mice. Black bars represent Sin3Bp+/– KraspG12D pancreas, and gray bars represent Sin3Bp–/– KraspG12D pancreas. (H) Kaplan-Meier Survival curve of Sin3Bp+/– KraspG12D mice (black, n = 42) and Sin3Bp–/– KraspG12D mice (red, n = 26). P < 0.05 at 300 days.
Figure 2
Figure 2. Sin3B deletion does not affect the ADM process in a cell-autonomous manner.
(A) H&E staining of paraffin sections of pancreas obtained from 8- and 24-week-old Sin3Bp+/– KraspG12D and Sin3Bp–/– KraspG12D mice. (B) Immunofluorescence on cryogenic sections of 6-week-old Sin3Bp+/– KraspG12D and Sin3Bp–/– KraspG12D pancreata using anti–α-amylase antibody (red). Nuclei are counterstained with DAPI in blue. (C) Immunofluorescence on cryogenic sections of Sin3Bp–/– KraspG12D pancreas using anti–α-amylase antibody (red) and anti-CK19 antibody (green). Nuclei are counterstained with DAPI (blue). (D) Immunofluorescence on the 3D structure obtained from acinar cells isolated from Sin3Bp+/– KraspG12D and Sin3Bp–/– KraspG12D pancreata 1 day (d) and 5 days after plating in 3D culture using anti–α-amylase antibody (red) and anti-CK19 antibody (green). Nuclei are counterstained with toproisomerase (TOPRO, blue). (E) Number of sphere-like structures obtained from acinar cells isolated from Sin3Bp+/– KraspG12D (black bars, n = 3) and Sin3Bp–/– KraspG12D (gray bars, n = 3) pancreata at 1 day, 3 days, and 5 days after plating in 3D culture. Scale bars: 50 μm (A, B); 25 μm (C, D).
Figure 3
Figure 3. Sin3B deletion impairs oncogene KRAS-induced senescence in vivo.
(A) Quantitative PCR for Dec1, p15INK4B, p53, and p21 mRNA expression in pancreata obtained from 6- to 8-week-old Sin3Bp+/– KraspG12D (black bars, n = 3) and Sin3Bp–/– KraspG12D (gray bars, n = 3) mice. Sin3Bp–/– KraspG12D expression is relative to Sin3Bp+/– KraspG12D expression. *P < 0.05; **P < 0.00001. (B) Cryogenic sections stained for SA–β-gal in Sin3Bp+/– KraspG12D and Sin3Bp–/– KraspG12D pancreata. (C) Immunochemistry for p-HP1γ on paraffin sections of 8-week-old Sin3Bp+/– KraspG12D and Sin3Bp–/– KraspG12D pancreata. (D) Immunochemistry for DEC1 on paraffin sections of 8-week-old Sin3Bp+/– KraspG12D and Sin3Bp–/– KraspG12D pancreata. Arrows indicate positively stained cells. Scale bars: 50 μm. (E) Percentage of DEC1-positive ductal cells at 6 to 8 weeks and at 24 weeks in Sin3Bp+/– KraspG12D and Sin3Bp–/– KraspG12D pancreata. ND, not detected. *P < 0.05.
Figure 4
Figure 4. Loss of SIN3B mitigates oncogenic KRAS-driven inflammatory response in vivo.
(A) Masson trichrome staining of paraffin sections of 8-week-old, 24-week-old, and 12-month-old WT, Sin3Bp+/– KraspG12D, and Sin3Bp–/– KraspG12D mice. (B) IHC for CD45 in pancreata obtained from 8-week-old, 24-week-old, and 12-month-old Sin3Bp+/– KraspG12D and Sin3Bp–/– KraspG12D mice. (C) Quantitative PCR for Il6 and Il1a mRNA expression in pancreata obtained from 6- and 8-week-old (6/8 weeks) and 24-week-old Sin3Bp+/– KraspG12D and Sin3Bp–/– KraspG12D mice. Black bars represent Sin3Bp+/– KraspG12D pancreas, and gray bars represent Sin3Bp–/– KraspG12D pancreas. Sin3Bp–/– KraspG12D mRNA expression levels are relative to the Sin3Bp+/– KraspG12D expression levels. *P < 0.01; **P < 0.05. (D) IHC for CD68 and F4/80 in pancreata obtained from 8-week-old Sin3Bp+/– KraspG12D and Sin3Bp–/– KraspG12D mice. Scale bars: 50 μm.
Figure 5
Figure 5. SIN3B is required for cell-autonomous Il1a expression.
(A) Pathway enrichment analysis using DAVID gene ontology for genes affected transcriptionally by Sin3B deletion. Pathway enrichment shows genes transcriptionally repressed (top) or induced (bottom) after Sin3B deletion in KraspG12D pancreas. GO analyses were made on genes that presented at least a 1.5-fold significant expression change in Sin3Bp–/– KraspG12D compared with Sin3Bp+/– KraspG12D pancreas (P < 0.05). Bars represent fold enrichment of the pathway in order of significance (P values) listed on the right of the bars. Functional categorizations of differentially expressed genes upon knockout of Sin3B were analyzed by Gene Ontology Biological Process (GO_BP) with the DAVID. (B) Heat map representation of enriched expression for cytokines, NF-κB, and IL-1α pathways in Sin3Bp+/– KraspG12D and Sin3Bp–/– KraspG12D pancreata and PDEC lines. Heat map represents top enriched genes in Sin3Bp–/– KraspG12D compared with Sin3Bp+/– KraspG12D pancreata. NES, normalized enrichment score (red, high expression; blue, low expression). (C) Quantitative PCR for Sin3B and Il1a mRNA expression in PDEC cultures obtained from Sin3Bp+/– KraspG12D (black bars) and Sin3Bp–/– KraspG12D (gray bars) pancreata. Sin3Bp–/– KraspG12D mRNA expression levels are relative to the Sin3Bp+/– KraspG12D expression levels. (D) Quantitative PCR for Il1a mRNA expression in acinar 3D cultures obtained from Sin3Bp+/– KraspG12D and Sin3Bp–/– KraspG12D mice 1 day, 3 days, and 5 days after plating in 3D culture. Black bars represent Sin3Bp+/– KraspG12D cells, and gray bars Sin3Bp–/– KraspG12D cells. Sin3Bp–/– KraspG12D mRNA expression levels are relative to the Sin3Bp+/– KraspG12D expression levels. *P < 0.01; **P < 0.05.
Figure 6
Figure 6. SIN3B levels correlate with an inflammatory response in both human pancreatic tissue and cancer cells.
(A) Immunohistochemical staining for SIN3B, p-STAT3, and IL-1α in human pancreatic tissue microarrays. Representative IHC staining is shown for normal pancreas, pancreas presenting pancreatitis, PanINs, and PDAC. (B) Immunohistochemical staining for DEC1 and IL-1α in human pancreatic tissue microarrays. Representative IHC staining is shown for normal pancreas, pancreas presenting pancreatitis, PanINs, and PDAC. Scale bars: 50 μm. (C) Quantitative PCR for SIN3B and IL1A mRNA expression in AsPc1 pancreatic cancer cells infected with empty vector (black bars) or shRNA against SIN3B (shSIN3B, gray bars). *P < 0.005; **P < 0.05. shSIN3B mRNA expression levels are relative to the empty vector expression levels.

References

    1. Hezel AF, Kimmelman AC, Stanger BZ, Bardeesy N, Depinho RA. Genetics and biology of pancreatic ductal adenocarcinoma. Genes Dev. 2006;20(10):1218–1249. doi: 10.1101/gad.1415606. - DOI - PubMed
    1. Aguirre AJ, et al. Activated Kras and Ink4a/Arf deficiency cooperate to produce metastatic pancreatic ductal adenocarcinoma. Genes Dev. 2003;17(24):3112–3126. doi: 10.1101/gad.1158703. - DOI - PMC - PubMed
    1. Guerra C, Barbacid M. Genetically engineered mouse models of pancreatic adenocarcinoma. Mol Oncol. 2013;7(2):232–247. doi: 10.1016/j.molonc.2013.02.002. - DOI - PMC - PubMed
    1. Hingorani SR, et al. Preinvasive and invasive ductal pancreatic cancer and its early detection in the mouse. Cancer Cell. 2003;4(6):437–450. doi: 10.1016/S1535-6108(03)00309-X. - DOI - PubMed
    1. Hruban RH, et al. Pancreatic intraepithelial neoplasia: a new nomenclature and classification system for pancreatic duct lesions. Am J Surg Pathol. 2001;25(5):579–586. doi: 10.1097/00000478-200105000-00003. - DOI - PubMed

Publication types

MeSH terms