

Review
doi: 10.1101/cshperspect.a008961.
Structure-function relationships of ErbB RTKs in the plasma membrane of living cells
Affiliations
- PMID: 24691959
- PMCID: PMC3970415
- DOI: 10.1101/cshperspect.a008961
Item in Clipboard
Review
Structure-function relationships of ErbB RTKs in the plasma membrane of living cells
Cold Spring Harb Perspect Biol.
.
Abstract
We review the states of the ErbB family of receptor tyrosine kinases (RTKs), primarily the EGF receptor (EGFR, ErbB1, HER1) and the orphan receptor ErbB2 as they exist in living mammalian cells, focusing on four main aspects: (1) aggregation state and distribution in the plasma membrane; (2) conformational features of the receptors situated in the plasma membrane, compared to the crystallographic structures of the isolated extracellular domains; (3) coupling of receptor disposition on filopodia with the transduction of signaling ligand gradients; and (4) ligand-independent receptor activation by application of a magnetic field.
Figures
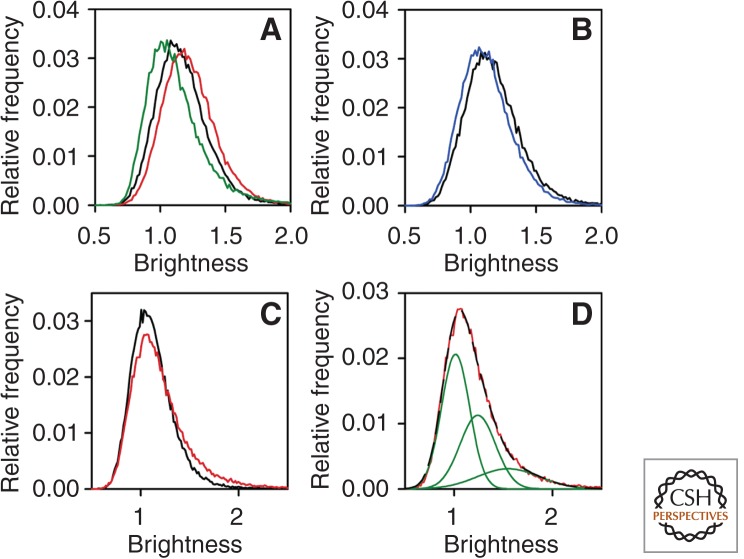
Clustering of ErbB1 in quiescent and EGF-stimulated cells measured by N&B. (A) Starved F1-4 cells expressing 5 × 10⁵ receptors were measured before and after stimulation with EGF for 3 min. The brightness histograms are plotted for quiescent (black line) and the EGF-stimulated cells (red line). The brightness histogram of soluble monomeric eGFP is shown by the green line. (B) Starved F1-4 cells were photobleached until their fluorescence intensity reached ∼20% of the initial value and the brightness histograms of the control (black line) and the bleached (blue line) cells are shown. (C) Brightness histograms of F1-10 cells expressing 5 × 10 4 receptors before ligand (starved [black line]) and after ligand (EGF-stimulated [red line]) addition for 3 min. (D) The brightness histogram of EGF-stimulated F1-10 cells (red line) was fitted by three overlapping Gaussians (green lines). The sum of the three fitted Gaussian distributions perfectly overlapping the experimentally determined histogram is shown by the black, long dashed line. (From Nagy et al. 2010; reproduced, with permission, from the National Academy of Sciences © 2010.)
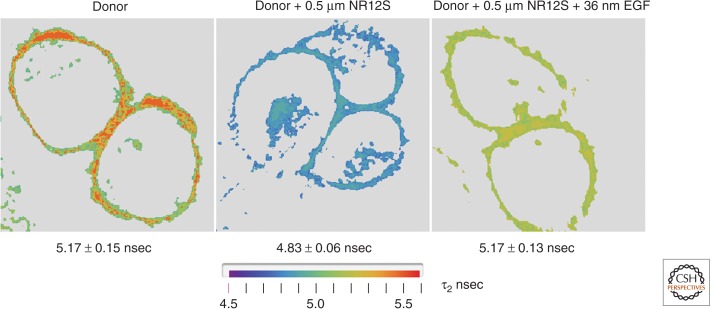
Conformational change of membrane-bound ErbB1 upon EGF binding as determined from FRET data. Stable Chinese hamster ovary (CHO) cell line transfected with the acyl carrier protein tag fused to the amino terminus of the ErbB1 ectodomain. The target serine residue was covalently labeled by phosphopantetheine transferase with Atto390-CoA. Atto390 emits at 480 nm and served as the FRET donor. Living cells were examined in an Olympus-PicoQuant FLIM microscope system with two-photon, 80-MHz excitation at 740 nm. Lifetime images for representative cells under three conditions are shown: (left) donor only; (middle) donor plus Nile Red12S (NR12S) membrane dye (applied at 0.5 µm) that localizes in the outer leaflet and acted as the FRET acceptor (Kucherak et al. 2010). NR12S absorbs broadly from 450 to 550 with a Förster R0 of 5.4 nm and emits at >590 nm; and (right) donor and acceptor labeled cells bathed in 1 µm ErbB1 kinase inhibitor PD153035 and exposed to 32 nm EGF (room temperature, 5 min). Image acquisition was performed until the mean value for the brightest pixels reached 1000 counts using the PicoQuant SymphoTime TCSCP software. Pixel data (photon arrival times) were entered into a laboratory-generated Mathematica program for (i) selecting an analysis region of interest (ROI), (ii) filtering (masking and intensity ordering), and (iii) computing lifetimes from the intensity binned pixel data, assuming a two-component decay and using an analytical function to represent the experimental impulse response function (IRF) and the corresponding fluorescence time course (see Ziomkiewicz et al. 2013). The mean ± s .e . lifetime values are given below each panel. There was an ∼7% drop in mean lifetime upon addition of the NR12S acceptor in the absence of EGF; this effect was substantially reversed upon addition of EGF (in the presence of kinase inhibitor) although the peak values originally observed in the absence of acceptor were not achieved. Data derived from experiments similar to those in Ziomkiewicz et al. (2013). We conclude that EGF binding, even in the absence of (auto)phosphorylation, leads to a conformational change, extending the ectodomain and thereby increasing the distance of the amino terminus from the plasma membrane in accordance with the model proposed from crystallographic analysis of isolated ErbB1 and its fragments. Larger separation correlates with a lower FLIM-detected FRET efficiency.
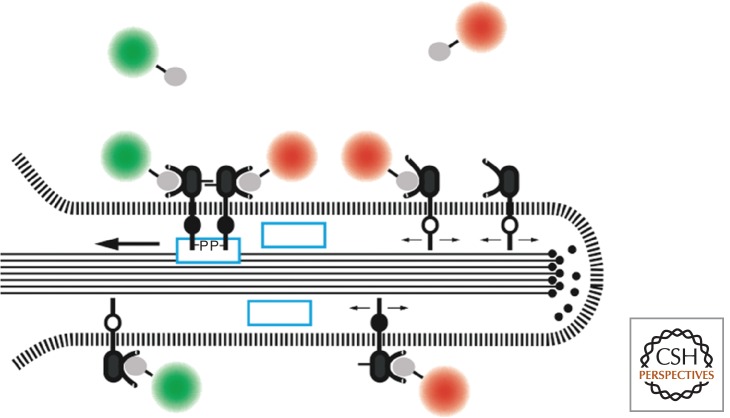
Filopodial retrograde transport of ErbB1. Recent studies identify Shc1 as a component (blue box) linking the activated receptor to the actin filaments constituting the core of the filopodium (see text). (From Lidke et al. 2005; adapted, with permission, from Rockefeller University Press © 2005.)
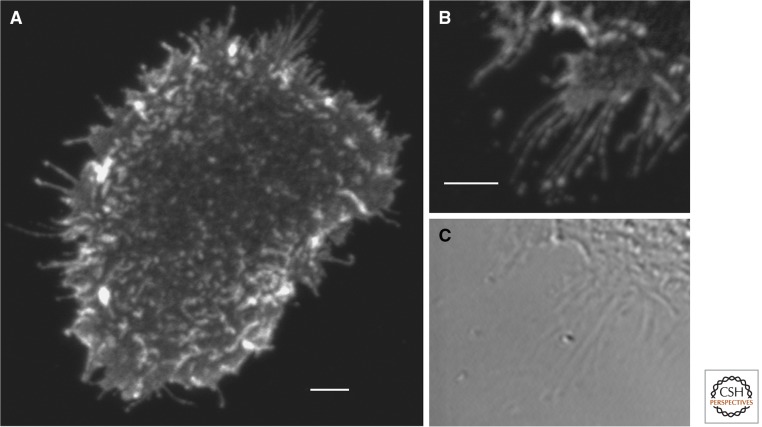
Preferential activation of ErbB1 on filopodia and microvilli with short exposure to EGF. Starved A431 cells were exposed for 40 sec to 15 nm EGF and fixed directly in ice cold EtOH. Activated ErbB1 was detected by immunofluorescence using a phosphotyrosine-specific ErbB1 antibody (pY1068) from cell signaling and a Cy3-labeled secondary antibody. No signal was observed on cells not exposed to EGF. Images were taken on a Zeiss 510 Meta microscope using 532 nm excitation and emission ≥585 nm. Background subtracted. Scale bars, 5 µm.

Binding of SPIONS to A431 cells and activation by exposure to a magnet for 180 sec. Panels (A) and (B) show specific binding of anti-ErbB1-targeted SPIONs on A431 cells after incubation for 15 min at 15°C. Panels (C) and (D) show the amount of transphosphorylation of ErbB1 on the cells after no magnetic field (C), or after application of a magnetic field for 180 sec (D) by indirect immunofluorescence staining for anti-ErbB1 pY1068. Data from experiments are similar to those published in Bharde et al. (2013). Scale bar, 20 µm.
References
-
- Alexi X, Berditchevski F, Odintsova E 2011. The effect of cell-ECM adhesion on signalling via the ErbB family of growth factor receptors. Biochem Soc Trans 39: 568–573 - PubMed
-
- Berger MB, Mendrola JM, Lemmon MA 2004. ErbB3/HER3 does not homodimerize upon neuregulin binding at the cell surface. FEBS Lett 569: 332–336 - PubMed
Publication types
MeSH terms
Substances
LinkOut - more resources
Full Text Sources
Other Literature Sources
Research Materials
Miscellaneous