Review
. 2014 Apr;94(2):461-518.
doi: 10.1152/physrev.00033.2013.

Sialic acids in the brain: gangliosides and polysialic acid in nervous system development, stability, disease, and regeneration

Review

Sialic acids in the brain: gangliosides and polysialic acid in nervous system development, stability, disease, and regeneration

Ronald L Schnaar et al. Physiol Rev. 2014 Apr.

Abstract

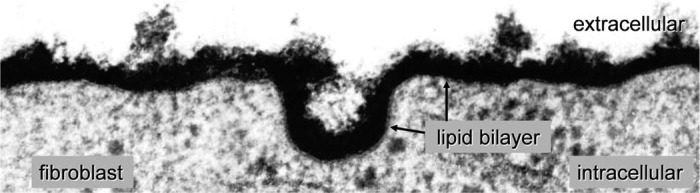
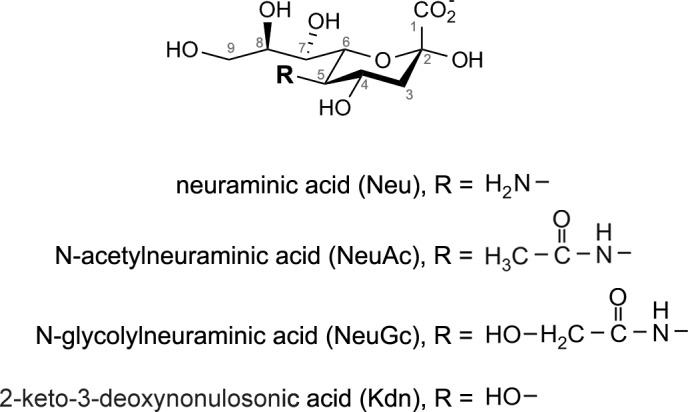
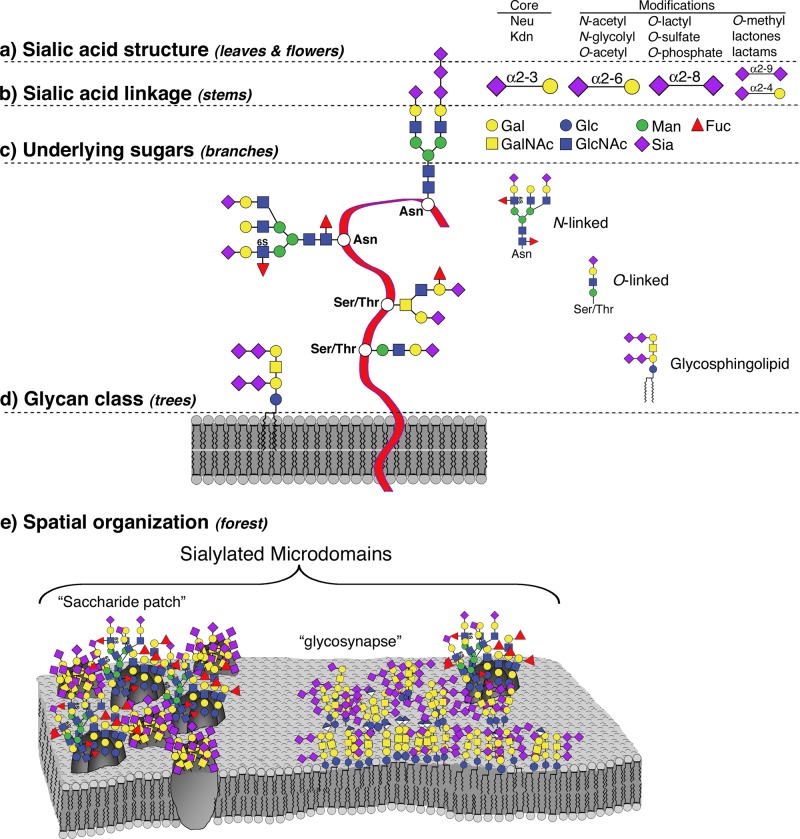
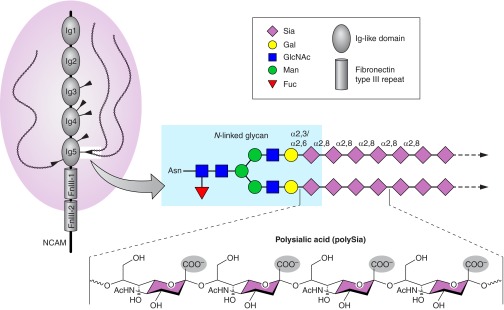
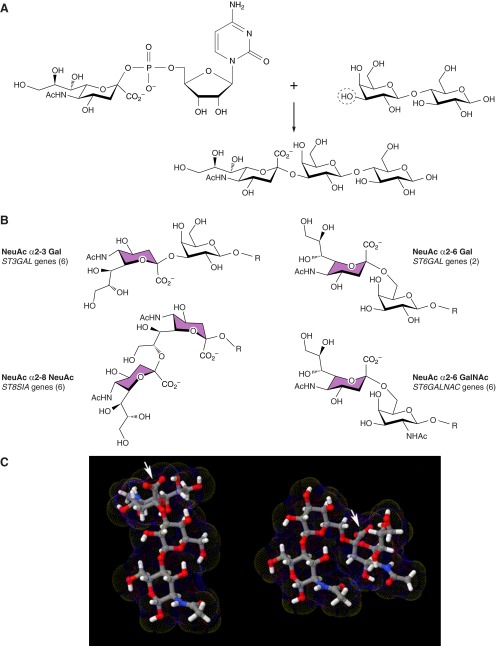
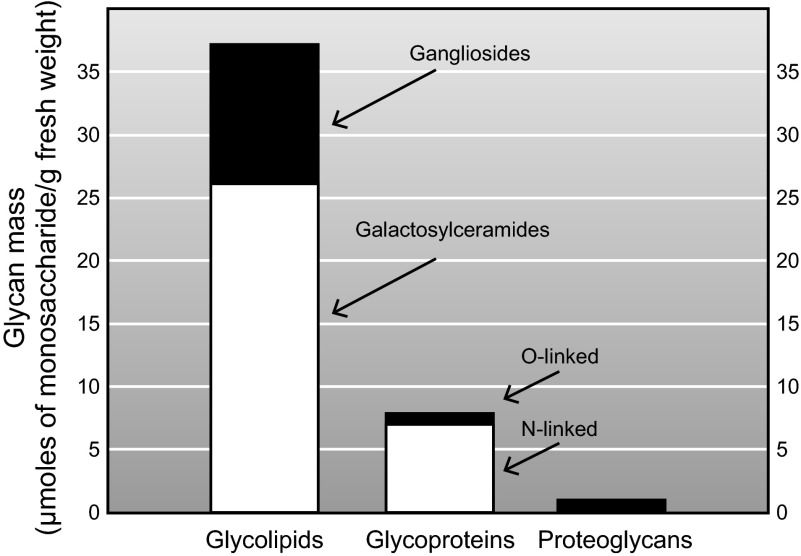
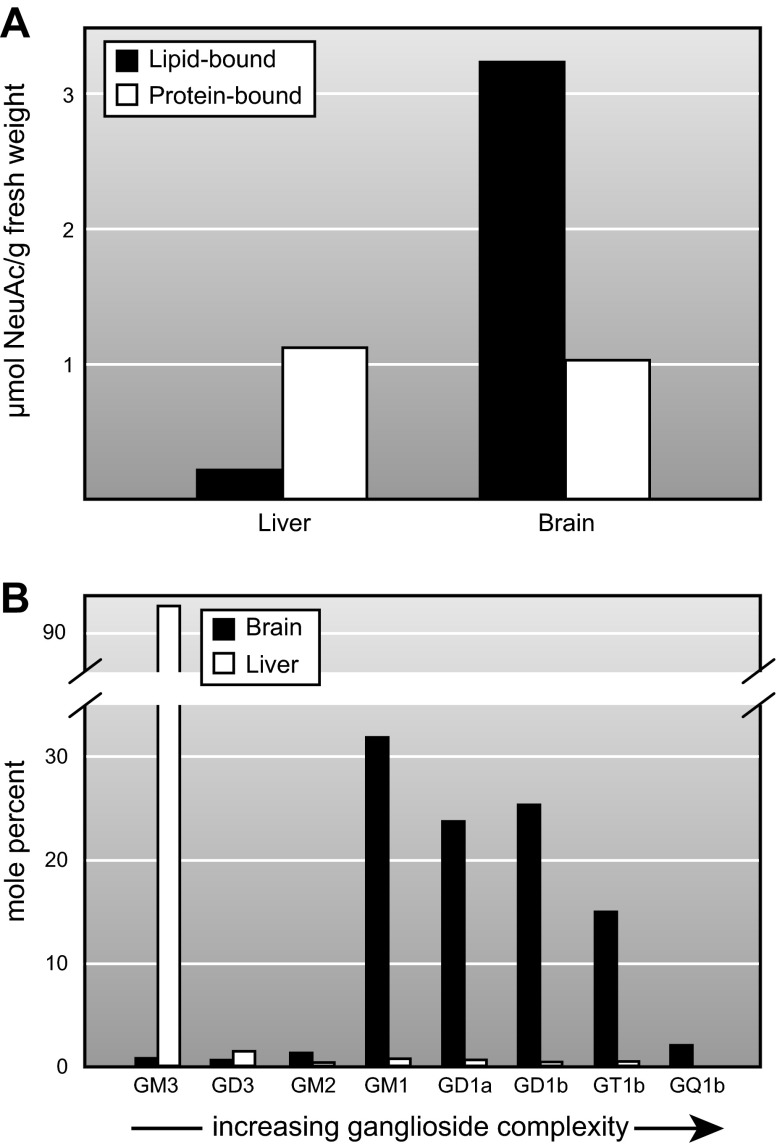
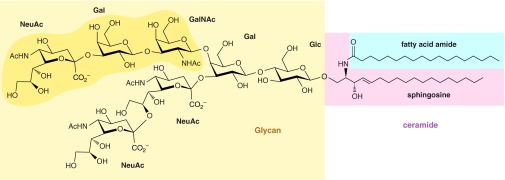
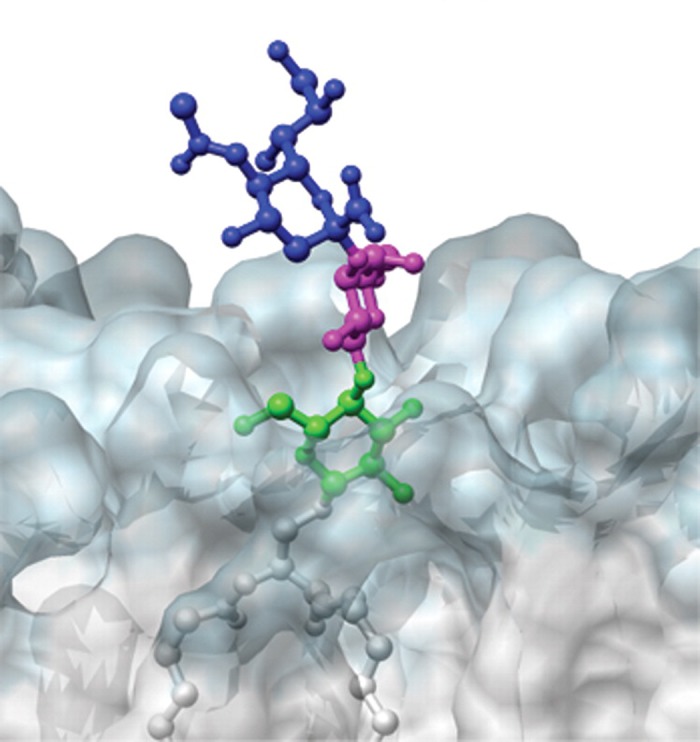
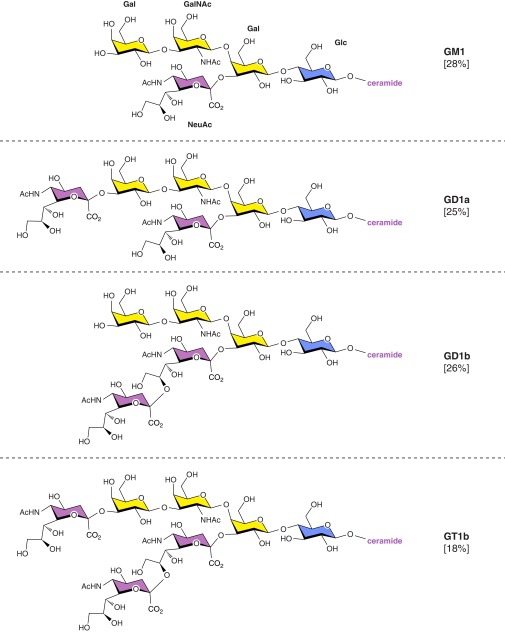
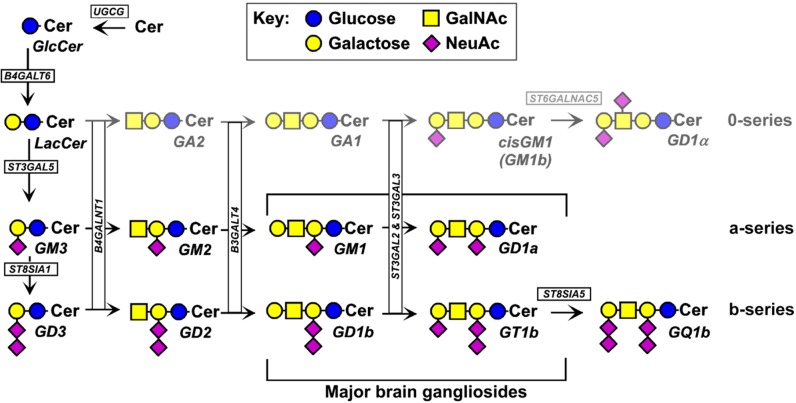
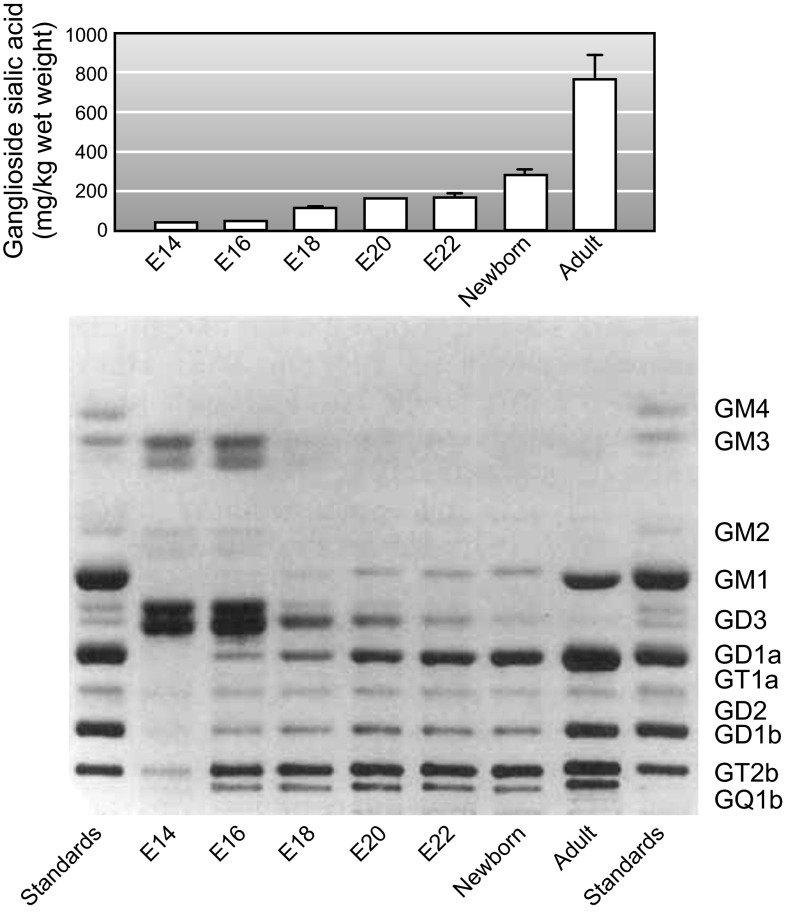
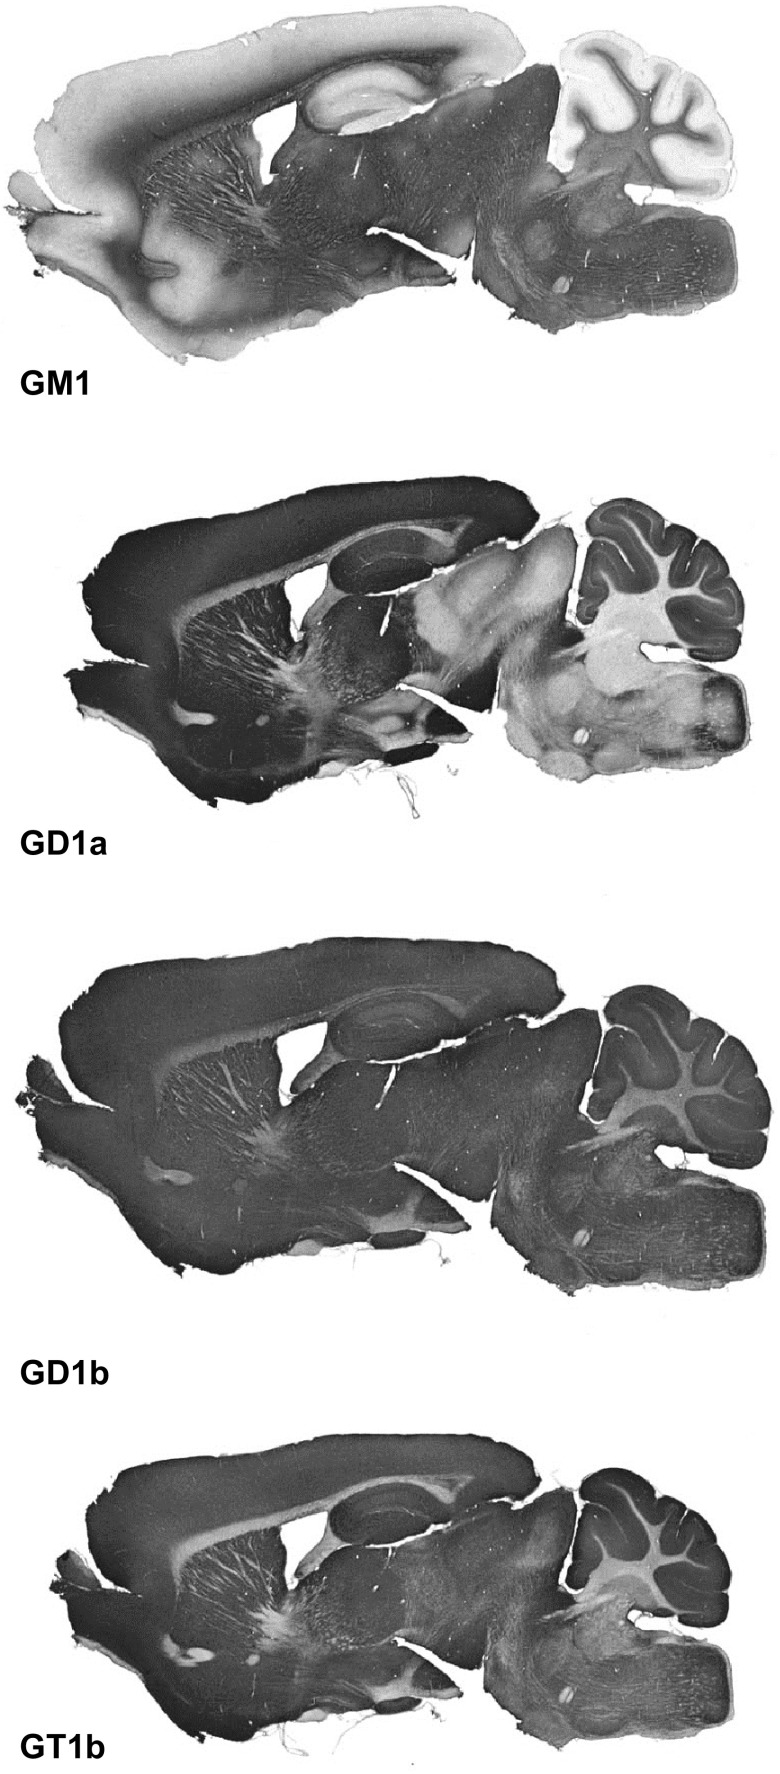
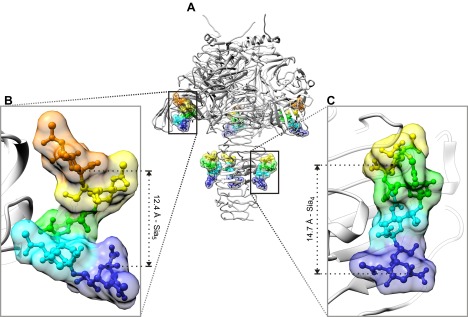
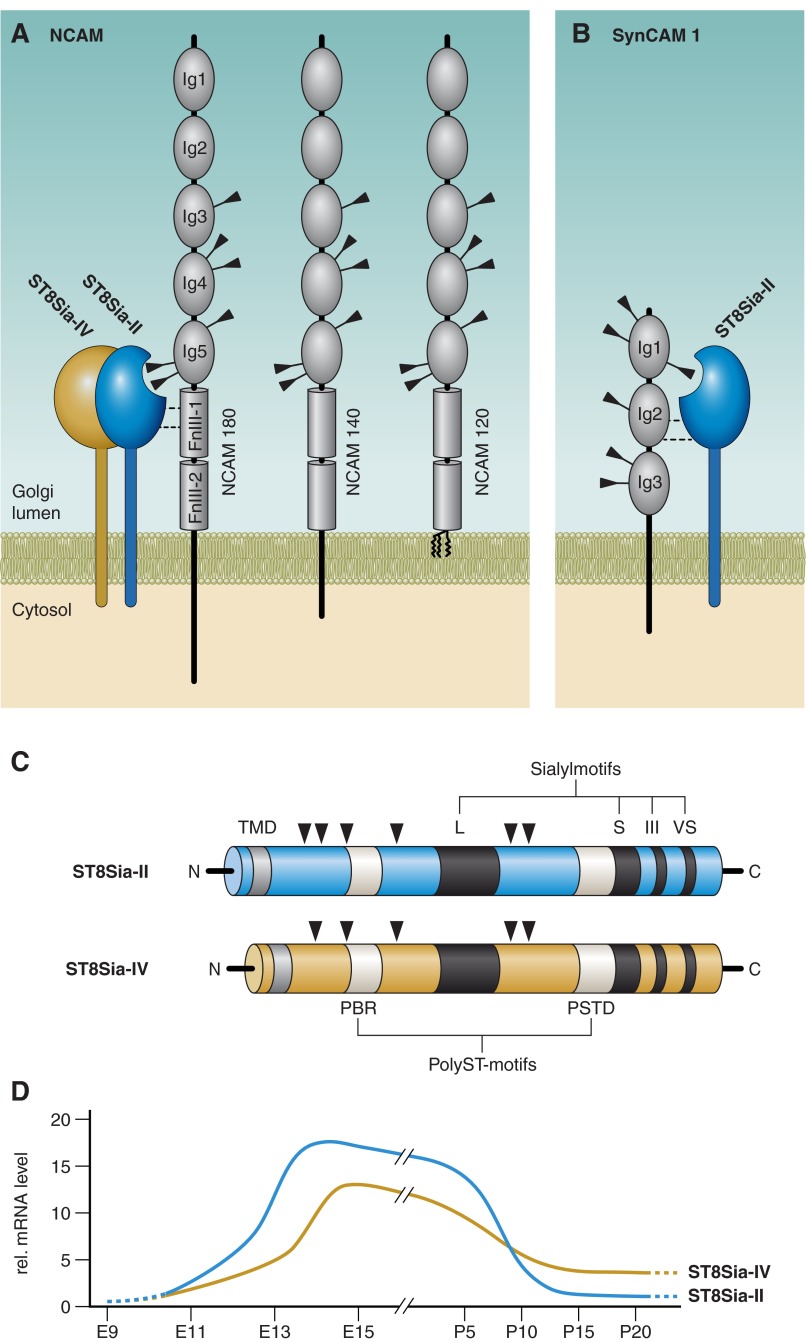
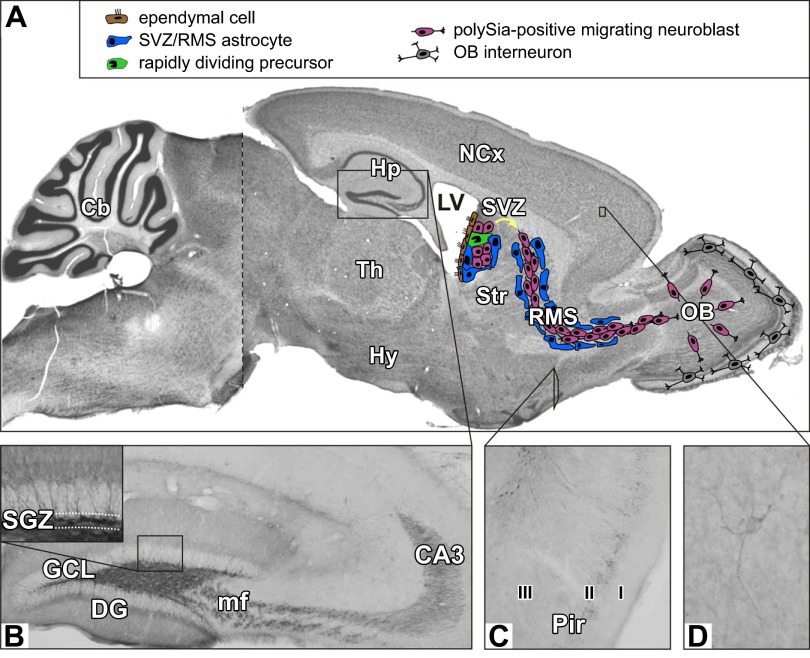
Every cell in nature carries a rich surface coat of glycans, its glycocalyx, which constitutes the cell's interface with its environment. In eukaryotes, the glycocalyx is composed of glycolipids, glycoproteins, and proteoglycans, the compositions of which vary among different tissues and cell types. Many of the linear and branched glycans on cell surface glycoproteins and glycolipids of vertebrates are terminated with sialic acids, nine-carbon sugars with a carboxylic acid, a glycerol side-chain, and an N-acyl group that, along with their display at the outmost end of cell surface glycans, provide for varied molecular interactions. Among their functions, sialic acids regulate cell-cell interactions, modulate the activities of their glycoprotein and glycolipid scaffolds as well as other cell surface molecules, and are receptors for pathogens and toxins. In the brain, two families of sialoglycans are of particular interest: gangliosides and polysialic acid. Gangliosides, sialylated glycosphingolipids, are the most abundant sialoglycans of nerve cells. Mouse genetic studies and human disorders of ganglioside metabolism implicate gangliosides in axon-myelin interactions, axon stability, axon regeneration, and the modulation of nerve cell excitability. Polysialic acid is a unique homopolymer that reaches >90 sialic acid residues attached to select glycoproteins, especially the neural cell adhesion molecule in the brain. Molecular, cellular, and genetic studies implicate polysialic acid in the control of cell-cell and cell-matrix interactions, intermolecular interactions at cell surfaces, and interactions with other molecules in the cellular environment. Polysialic acid is essential for appropriate brain development, and polymorphisms in the human genes responsible for polysialic acid biosynthesis are associated with psychiatric disorders including schizophrenia, autism, and bipolar disorder. Polysialic acid also appears to play a role in adult brain plasticity, including regeneration. Together, vertebrate brain sialoglycans are key regulatory components that contribute to proper development, maintenance, and health of the nervous system.


Figures

FIGURE 1.
FIGURE 1.
Glycocalyx. All cells carry a surface glycan coat which varies in size and composition. In the electron micrograph shown (magnification ×120,000), the glycan coat of a fibroblast in culture (BHK-21 cell) appears black after staining with ruthenium red. The underlying lipid bilayer of the plasma membrane is distinctly visible as a gray strand. The glycocalyx extends outward ∼40 nm, dwarfing the ∼6-nm-thick bilayer. [From Martinez-Palomo et al. (286). Reprinted by permission of the American Association for Cancer Research.]
FIGURE 2.
FIGURE 2.
Sialic acids. The sialic acids of animals are based on neuraminic acid (Neu), which is typically found in its N-acetyl (NeuAc) or N-glycolyl (NeuGc) forms, or on 2-keto-3-deoxy-nonulosonic acid (Kdn). Other modifications (O-acylation, sulfation, phosphorylation, cyclization) result in >50 naturally occurring structures (412).
FIGURE 3.
FIGURE 3.
Hierarchical levels of sialome complexity. The sialome can be analyzed at the following complexity levels. A: sialic acid core and core modifications: esterification (with various groups), O-methylation, lactonization, or lactamization yielding >50 different structures. B: linkage to the underlying sugar (four major and many minor linkages). C: identity and arrangement of the underlying sugars that can also be further modified by fucosylation or sulfation. D: glycan class (N-linked, O-linked, or glycosphingolipids). E: spatial organization of the Sia in sialylated microdomains, which have been referred to as “clustered saccharide patches” (509) or “the glycosynapse” (182). Gal, galactose (Gal), GalNAc, N-acetylgalactosamine; Glc, glucose; GlcNAc, N-acetylglucosamine; Man, mannose; Sia, sialic acid; Fuc, fucose; Asn, asparagine; Ser, serine; Thr, threonine. [Adapted from Cohen and Varki (86), with permission from Mary Ann Liebert, Inc.]
FIGURE 4.
FIGURE 4.
Schematic representation of polysialylated NCAM. NCAM is a prototypic member of the immunoglobulin family of cell adhesion molecules with five immunoglobulin-like modules (Ig1 to Ig5) and two fibronectin type III repeats (FnIII-1 and FnIII-2) in the extracellular domain. Of the six N-glycosylation sites (indicated by black arrowheads on Ig3, Ig4, and Ig5), only two, located in the 5th Ig-like domain, can be extended by the addition of polySia, a homopolymer of α2–8-linked sialic acid residues. One of several possible core glycans is depicted (see text for details). PolySia chains are linked to complex glycans with the first sialic acid in α2–3 or α2–6 linkage. PolySia chains can comprise >90 monomer units, leading to polyanions (negatively charged carboxylate groups are highlighted with gray spheres) with high water binding capacity. The large hydration shell formed by polySia markedly increases the hydrodynamic volume of its carrier molecule and thus interferes with its natural binding capabilities. Bound to NCAM, polySia is believed to invert an adhesive into a repelling molecule.
FIGURE 5.
FIGURE 5.
Sialyltransferases. A: sialoglycans are synthesized by the enzymatic transfer of sialic acid from the activated nucleotide sugar donor CMP-sialic acid, to an acceptor (e.g., the 3-carbon hydroxyl of the galactose of the disaccharide lactose, circled) to form a glycosidic linkage (e.g., NeuAc α2–3 Gal). B: there are 20 human sialyltransferase genes in four families designated by the major linkages they form. C: an example of the structural differences between α2–3 and α2–6 linked sialic acids. Each structure contains the acceptor disaccharide Gal β1–4 GlcNAc in the same orientation with a terminal sialic acid linked to the 3-carbon hydroxyl (left) or 6-carbon hydroxyl (right) of the terminal galactose. The position of the sialic acid carboxylate is designated by an arrow to assist in visualization. Three-dimensional structures were generated using Glycam-Web (www.glycam.org).
FIGURE 6.
FIGURE 6.
Glycans in the adult rat brain. The mass of constituent monosaccharides (μmol/g fresh brain wt) for each glycan class and subclass were calculated from published data as follows. 1) Galactosylceramide and sulfatide together represent 19.4 mg/g brain fresh wt, with 76% (by weight) being galactosylceramide (346). This represents ∼20.3 μmol galactosylceramide and ∼5.8 μmol sulfatide/g fresh wt. 2) Ganglioside sialic acid is expressed at 1.15 mg (3.9 μmol)/g fresh wt. Since there is an average of 2.9 ganglioside monosaccharides per ganglioside sialic acid, gangliosides represent 11.2 μmol monosaccharide/g fresh wt (482). 3) Glycoproteins represent 71 μmol monosaccharide/g lipid-free dry wt. Since lipid-free dry weight is ∼11% of brain fresh weight, glycoproteins represent ∼7.8 μmol monosaccharide/g fresh wt (281). Of these, O-linked GalNAc is expressed at 0.28 μmol/g fresh wt. Since there is an average of 3.2 O-linked monosaccharides per O-linked GalNAc, O-linked glycoproteins represent 0.88 μmol/g fresh wt (139). Proteoglycan hexosamine is expressed at 4.1 μmol/g lipid-free dry wt in the adult rat brain (∼8.1 μmol total monosaccharide/g dry wt). Based on lipid-free dry weight being 11% of fresh weight, proteoglycans represent 0.89 μmol/g fresh wt (282). [From Schnaar (421), by permission of Oxford University Press.]
FIGURE 7.
FIGURE 7.
Sialoglycoproteins and gangliosides in liver and brain. A: protein-bound sialic acid is equivalent in the two tissues, whereas expression of lipid-bound sialic acids (gangliosides) is >10-fold higher in the brain. B: ganglioside patterns (mol%) in human brain and liver. Data compiled from References 5, 342, 482. [Adapted from Schnaar (420), with permission from Elsevier.]
FIGURE 8.
FIGURE 8.
Ganglioside GT1b. The glycan (shaded yellow) is in glycosidic linkage to the ceramide lipid which is comprised of a long-chain base (sphingosine, pink) bearing a fatty acid amide (blue). Within the glycan, the main binding site for myelin-associated glycoprotein is shaded (92, 565).
FIGURE 9.
FIGURE 9.
Atomic-resolution conformational analysis of ganglioside GM3 in a lipid bilayer. The image represents a 20-ns snapshot taken perpendicular to the plane of the bilayer near the head group of GM3. The ganglioside is shown as a ball-and-stick model and the membrane as a transparent space-filling model with the membrane hydrophilic region in blue and membrane hydrophobic region in white. [From DeMarco and Woods (110), by permission from Oxford University Press.]
FIGURE 10.
FIGURE 10.
The four major brain gangliosides of mammals and birds share the same neutral tetrasaccharide core (Gal β1–3 GalNAc β1–4 Gal β1–4 Glc) attached to ceramide, with varying numbers and linkage positions of sialic acids. The sugars are color-coded: yellow, Gal/GalNAc; blue, Glc; and purple, NeuAc. Molar percentages are for total human brain gangliosides.
FIGURE 11.
FIGURE 11.
Brain ganglioside biosynthesis. Complex brain gangliosides are biosynthesized stepwise by the action of a suite of glycosyltransferases. The genes responsible for the expression of each glycosyltransferase are boxed (see Table 1).
FIGURE 12.
FIGURE 12.
Ganglioside expression during brain development. Top: rat brain ganglioside expression (ganglioside sialic acid density as mg/kg wet wt) during brain development. Bottom: equal amounts of extracted brain gangliosides from each developmental age indicated were resolved by thin-layer chromatography and stained using a sialic acid-specific colorimetric reagent (resorcinol-HCl). Gangliosides GM3, GM2, and GD3 migrate as double bands due to ceramide lipid diversity. [Adapted from Yu et al. (573), with permission from John Wiley and Sons, Inc.]
FIGURE 13.
FIGURE 13.
Ganglioside immunohistochemistry on adult wild-type C57Bl/6 mouse mid-sagittal brain sections. [Adapted from Sturgill et al. (467), by permission of Oxford University Press.]
FIGURE 14.
FIGURE 14.
The conformational freedom inherent in polySia chains has been instructively displayed by cocrystallization with an inactive from of the polySia degrading endosialidaseNF. A: endosialidases are homotrimeric enzymes with an overall mushroomlike outline (466). In addition to the active site (not shown), each monomer contains two peripheral high-affinity binding sites for polySia in the head (B) and the stalk (C) of the mushroom (431). The polySia structures cocrystallized with the enzyme clearly indicated two different conformations of the polymer. The Sia5 molecule bound to the head domain attains a compressed conformation with the distance between the C2 carbons of the most distant sugars being only 12.4 Å. In contrast, in the Sia4 fragment at the stalk domain, the distance from the C2 carbon at the reducing end sugar to the C2 carbon at the nonreducing end sugar is 14.7 Å. This relaxed helical pitch is similar to the soluble state structure described for polySia (558). These data demonstrate that the binding partner imposes structural information onto polySia chains.
FIGURE 15.
FIGURE 15.
A: the predominant polySia acceptor is the neural cell adhesion molecule (NCAM). The three major isoforms NCAM-180, -140, and -120 share identical extracellular domain structures but vary with respect to the size of the intracellular domain. In cell culture, all isoforms are polysialylated, and polySia is selectively transferred onto two N-glycans in the 5th immunoglobulin like module (Ig5). The absence of region-specific core glycans in these positions (see text) prompted the suggestion that membrane-bound polysialyltransferases require specific spacing between acceptor glycans and their active sites (8). Later studies confirmed the model by demonstrating that the minimal polySia acceptor encompasses the tandem domains Ig5 and FnIII-1. Black triangles indicate N-glycosylation sites. B: the spacing model is also suited to explain the transfer of polySia onto selective N-glycans in other acceptors shown here SynCAM 1. Of note, both polySTs are independently able to polysialylate NCAM, while SynCAM 1 is specifically recognized by ST8Sia-II. The molecular basis of specific acceptor recognition is not known. C: schematic representation of the polysialyltransferases ST8Sia-II and ST8Sia-IV. Both polySTs consist of a short NH2-terminal cytosolic domain, a transmembrane domain (TMD), a stem region, and a COOH-terminal catalytic domain. The sialyl motifs large (L), short (S), motif III (III), and very short (VS) are conserved in all mammalian sialyltransferases (476) and are depicted as black boxes. The two polyST specific domains, termed polybasic region (PBR) and polyST specific domain (PSTD), are shown as white boxes. Black triangles indicate N-glycosylation sites. D: overview of ST8Sia-II and ST8Sia-IV expression during mouse brain development as determined by quantitative real-time RT-PCR from whole brain mRNA extracts (354, 417).
FIGURE 16.
FIGURE 16.
Hotspots of polySia immunoreactivity in the adult mouse brain. A: Nissl-stained sagittal section with a schematic representation of the neurogenic system of the anterior subventricular zone (SVZ) of the lateral ventricle (LV, lined by ependymal cells) and the rostral migratory stream (RMS) producing new interneurons of the olfactory bulb (OB). The neurogenic niche consists of slowly dividing astrocytes giving rise to rapidly dividing precursors, which in turn generate the migratory, polySia-positive neuroblasts. [Based on Doetsch et al. (121–123).] B: polySia expression on mossy fibers (mf) projecting from the granule cell layer (GCL) towards the CA3 region of the hippocampus (Hp) and in the subgranular zone (SGZ, inset), the neurogenic niche of the dentate gyrus (DG). C: pattern of polySia immunoreactivity in the piriform cortex (Pir; layer I-III). D: example of a polySia-positive interneuron in the prefrontal part of the neocortex (NCx). [B and C from Natcher et al. (327).] To facilitate orientation the approximate positions are indicated in A, but note that the micrographs shown in B and C were obtained from coronal sections. Cb, cerebellum; Hy, hypothalamus; Str, striatum; TH, thalamus.
FIGURE 17.
FIGURE 17.
Brain ganglioside patterns from wild-type and ganglioside mutant mice. Brain gangliosides were extracted, and an amount equivalent to 10 mg brain fresh wt was resolved by thin-layer chromatography. Glycolipids were detected colorimetrically. Migration positions of standard brain gangliosides are indicated on the sides of the panel. [Adapted from Kawai et al. (227), with permission from American Society for Biochemistry and Molecular Biology.]
FIGURE 18.
FIGURE 18.
Axon degeneration in complex ganglioside knockout (B4galnt1-null) mice. Top: pathological features in PNS (sciatic nerve). Low-power electron microscopic image showing axon degeneration with collapsed myelin (red asterisks) and a thinly myelinated fiber surrounded by supernumerary Schwann cell process (red arrow). Normal myelin is denoted with a blue asterisk for comparison. Scale bar = 2.5 μm. Bottom: pathological features in the CNS (optic nerve). Electron microscopic image showing axonal degeneration and myelin collapse (red arrow), and a large unmyelinated axon (red asterisk). Normal myelin is denoted with a blue asterisk for comparison. Scale bar = 200 nm. [Adapted from Sheikh et al. (447).]
FIGURE 19.
FIGURE 19.
Node of Ranvier defects in complex ganglioside knockout (B4galnt1-null) mice. A and B: electron micrographs of 12-wk-old paranodal loops from wild-type (A) and B4galnt1-null (B) mouse optic nerves. Some paranodal loops face away from the axon in the mutant mice (arrowheads). Scale bars = 0.5 μm. C and D: immunostained molecules at nodes of Ranvier from wild-type (C) and B4galnt1-null (D) mouse ventral roots. Sodium channel immunostaining (Nav, red) delineates the node, Caspr (green) delineates the paranode, and potassium channels (Kv1.2, green) delineate the juxtaparanode. In mutant mice, potassium channels invade the paranode, extending toward the node (arrowheads), and there is abnormal protrusion of sodium channels (arrow). [Adapted from Susuki et al. (469), with permission from John Wiley and Sons, Inc.]
FIGURE 20.
FIGURE 20.
Model for laminin-1-induced clustering of GM-1, TrkA, β1 integrin, and signaling molecules in lipid rafts to stimulate neurite outgrowth. Laminin-1 directly binds to GM1 and induces its focal aggregation, enhancing the relocation of TrkA in lipid rafts and the subsequent activation of signaling molecules downstream of TrkA, such as Lyn. Clustering of GM1 with laminin-1, along with laminin-1 self-assembly, also promotes relocation and enrichment of β1 integrin in lipid rafts and enhances combined laminin-integrin signaling to trigger neurite outgrowth. [From Ichikawa et al. (208), with permission from The Company of Biologists, Ltd.]
FIGURE 21.
FIGURE 21.
Crystal structure of botulinum neurotoxin type A in complex with the cell surface co-receptor GT1b. Top: close-up of the GT1b binding site. GT1b represented as sticks with yellow carbons. The GT1b coordinating residues are shown as sticks with gray carbons. Bottom: schematic picture of GT1b and its hydrogen bonds to botulinum neurotoxin type A. The hydrogen bonds between the protein (blue) and GT1b (black) are shown as dotted red lines and the GT1b internal hydrogen bonds as dotted black lines. Distances of key hydrogen bonds are displayed in Ångstroms. The α2,8-linked sialic acid (Sia7) that is disordered in the complex is shaded gray. Numbered monosaccharide names are shown; Glc, glucose; Gal, galactose; GalNAc, N-acetylgalactosamine; Sia, sialic acid. [Adapted from Stenmark et al. (461).]
FIGURE 22.
FIGURE 22.
MAG binding to gangliosides: structural specificity (91, 565). COS cells (fibroblasts) transfected to express full-length MAG were placed in microwells adsorbed with the indicated concentrations of the indicated gangliosides. MAG-mediated cell adhesion is expressed as a percent of the MAG-transfected cells added to each well. Ganglioside structures are shown schematically using the key in Figure 11. [Adapted from Collins et al. (91), with permission from American Society for Biochemistry and Molecular Biology, and Yang et al. (565).]
FIGURE 23.
FIGURE 23.
PolySia and cell interactions. A: polySia as a negative regulator of cell-cell apposition. Loss of polySia allows for trans-interactions of NCAM and other cell surface proteins. B and C: loss of polySia induces heterophilic trans-interactions and activates the protein kinase ERK1/2 via FGF receptor signaling (B), or promotes focal adhesion at the cell-substrate interface by interactions with a yet unknown heterophilic binding partner and signaling to the focal adhesion kinase (FAK) (C). D: polySia may interfere with cis-interactions of NCAM and signaling complex formation. E and F: loss of polySia enables interactions of NCAM with proteoglycans of the ECM (E), or polySia-NCAM itself interacts with proteoglycans of the ECM (F). G: polySia as a scavenger of soluble factors facilitating receptor activation. H: polySia modulates activation of ionotropic glutamate receptors. See text for details.
FIGURE 24.
FIGURE 24.
Two categories of neurodevelopmental defects in polySia-negative mice. A–D: shared features of 2−/−4−/− and Ncam knockout (N−/−) mice are caused by loss of polySia. A and B: migration deficits of olfactory interneuron precursors in the rostral migratory stream (RMS) and smaller olfactory bulbs (OB) in polysialyltransferase-negative (polyST−) 2−/−4−/− mice and polySia-NCAM-negative Ncam knockout mice. Wt, wild type. C: altered cytoarchitecture of the RMS in polyST− mice. The ordered arrangement of GFAP-positive astrocyte tunnels around migratory chains of NCAM-positive neuroblasts as observed in the wild-type (wt) is severely disturbed (H. Hildebrandt, unpublished data). D: schematic representation of the situation in the presence or absence of polySia, based on the work of Chazal et al. (76). E–I: defects that manifest exclusively in 2−/−4−/− and are absent from Ncam knockout and 2−/−4−/− N−/− triple-knockout mice are caused by a gain of polySia-free NCAM. E–G: misrouting of thalamocortical (green) and corticofugal fibers (red) in polyST- but not in 2−/−4−/− N−/− triple-knockout mice (NCAM−). Only in the polyST− situation, thalamocortical axons fail to pass through the internal capsule (ic) at embryonic day 14.5 (E and G) and fibers in the ventral thalamus (boxed in E) are reduced and highly disorganized at postnatal day 1 (F; high magnification views of the ventral thalamus at postnatal day 1 corresponding to the site boxed in E). Immunofluorescence with TAG1-, L1-, and neurofilament-specific antibodies and nuclear counterstain with DAPI as indicated. Th, thalamus; ctx, cortex. H: polySia on growth cones (arrowheads) and at the interface between fasciculated axons (arrows) in explants of embryonic mammillary body grown on laminin. Endosialidase treatment (endo) causes defasciculation (bottom right). Immunofluorescence with polySia- and β-III-tubulin-specific antibodies as indicated (H. Hildebrandt, unpublished data). I: schematic representation of the situation in the presence or absence of polySia on NCAM. [Micrographs in A, E, and F from Schiff et al. (416) and Weinhold et al. (541), with permission from American Society for Biochemistry and Molecular Biology.]
FIGURE 25.
FIGURE 25.
Gain of polySia-free NCAM determines axon tract deficits. A: compared with the wild-type situation (wt), 2−/−4−/− mice without functional polysialyltransferases (polyST−) show severe malformations of the internal capsule (ic, arrow) affecting fiber connections between thalamus (th) and cortex (ctx). B: the degree of the defect, based on morphometric evaluation at postnatal day 30 (P30), correlates with the relative levels of polySia-deficient NCAM determined during the developmental phase at postnatal day 1 (P1). Each of the data points stands for one of the nine mouse lines investigated (see text for details). The polyST-negative 2−/−4−/− mice show the strongest defect and the highest levels of polySia-negative NCAM, set to 100%, respectively. [Adapted from Hildebrandt et al. (195), by permission from Oxford University Press.]
FIGURE 26.
FIGURE 26.
Immunopathogenesis of the AMAN form of Guillain-Barré syndrome. Gangliosides GM1 and GD1a are strongly expressed at nodes of Ranvier, where the voltage-gated sodium (Nav) channels are localized. Anti-GM1 or anti-GD1a antibodies bind to the nodal axolemma, leading to formation of the complement membrane attack complex (MAC). This results in the disappearance of Nav clusters and the detachment of paranodal myelin, which can lead to nerve-conduction failure and muscle weakness. Axonal degeneration may follow at a later stage. Macrophages subsequently invade from the nodes into the periaxonal space, scavenging the injured axons. [Adapted from Yuki and Hartung (577), with permission from Massachusetts Medical Society.]
FIGURE 27.
FIGURE 27.
Campylobacter jejuni lipooligosaccharides and molecular mimicry in GBS. Top: carbohydrate mimicry between a ganglioside (GM1) and a Campylobacter jejuni lipooligosaccharide (LOS). The terminal tetrasaccharides are identical (dashed lines). Bottom: Campylobacter jejuni gene polymorphism as a determinant of clinical neuropathies after infection. C. jejuni that carries cst-II (Thr51) can express GM1-like and GD1a-like LOS on its cell surface, which upon infection may induce anti-GM1, anti-GD1a, or anti-GM1/GD1a complex IgG production. Since these products are expressed on motor nerves of the four limbs, binding induces acute motor axonal neuropathy. In contrast, C. jejuni that carries cst-II (Asn51) expresses GT1a-like or GD1c-like LOS on its cell surface, which upon infection may induce anti-GQ1b IgG production. Anti-GQ1b IgG antibody binds to GQ1b on oculomotor nerves and primary sensory neurons, inducing Fisher syndrome and related conditions. [Adapted from Yuki (575), with permission from John Wiley and Sons, Inc., and (576), with permission from Proceedings of the Japan Academy, Ser. B.]

References

    1. Abo-Ouf H, Hooper AW, White EJ, Janse van Rensburg HJ, Trigatti BL, Igdoura SA. Deletion of tumor necrosis factor-alpha ameliorates neurodegeneration in Sandhoff disease mice. Hum Mol Genet 22: 3960–3975, 2013 - PubMed
    1. Abrous DN, Montaron MF, Petry KG, Rougon G, Darnaudery M, Le Moal M, Mayo W. Decrease in highly polysialylated neuronal cell adhesion molecules and in spatial learning during ageing are not correlated. Brain Res 744: 285–292, 1997 - PubMed
    1. Acheson A, Sunshine JL, Rutishauser U. NCAM polysialic acid can regulate both cell-cell and cell-substrate interactions. J Cell Biol 114: 143–153, 1991 - PMC - PubMed
    1. Albach C, Damoc E, Denzinger T, Schachner M, Przybylski M, Schmitz B. Identification of N-glycosylation sites of the murine neural cell adhesion molecule NCAM by MALDI-TOF and MALDI-FTICR mass spectrometry. Anal Bioanal Chem 378: 1129–1135, 2004 - PubMed
    1. Alhadeff JA, Holzinger RT. Sialyltransferase, sialic acid and sialoglycoconjugates in metastatic tumor and human liver tissue. Int J Biochem 14: 119–126, 1982 - PubMed

Publication types