. 2015 Sep;25(9):2584-93.
doi: 10.1093/cercor/bhu057. Epub 2014 Mar 31.

Creating Concepts from Converging Features in Human Cortex

Affiliations

Creating Concepts from Converging Features in Human Cortex

Marc N Coutanche et al. Cereb Cortex. 2015 Sep.

Abstract

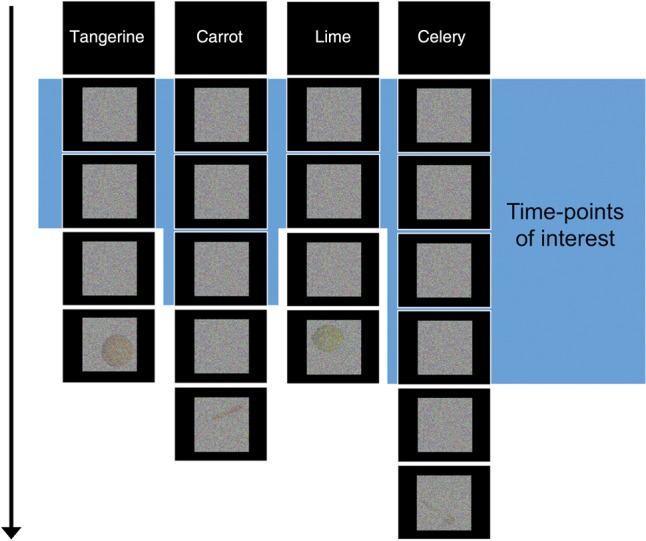
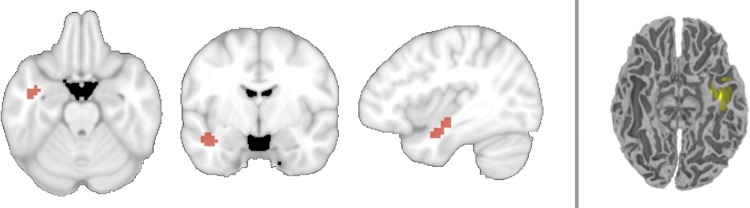
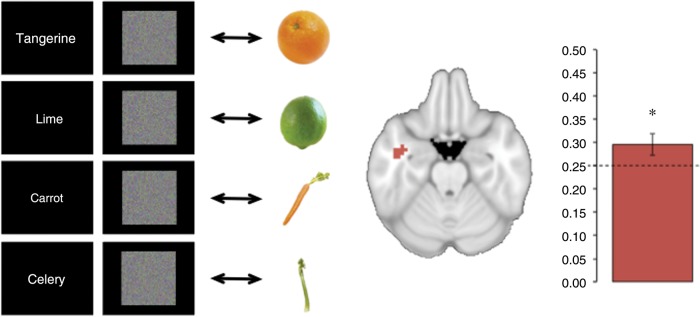
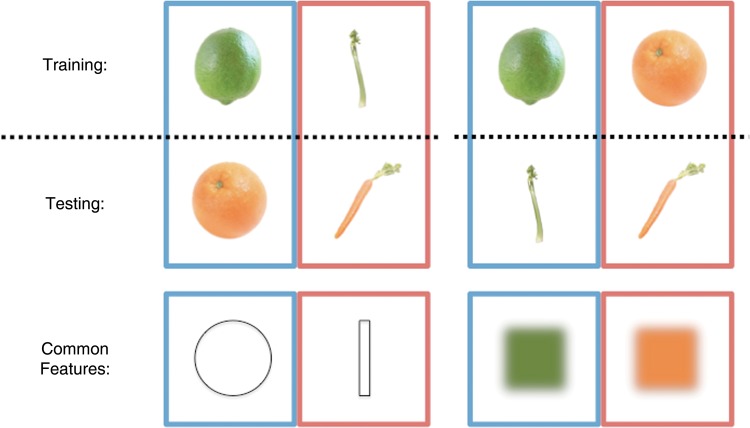
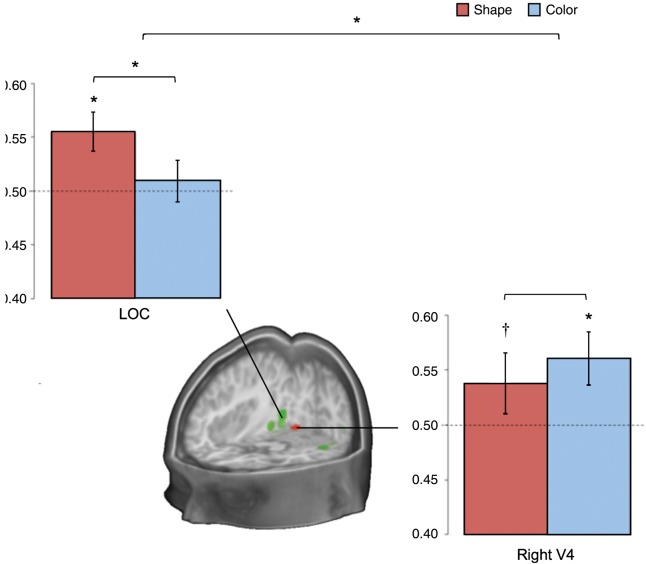
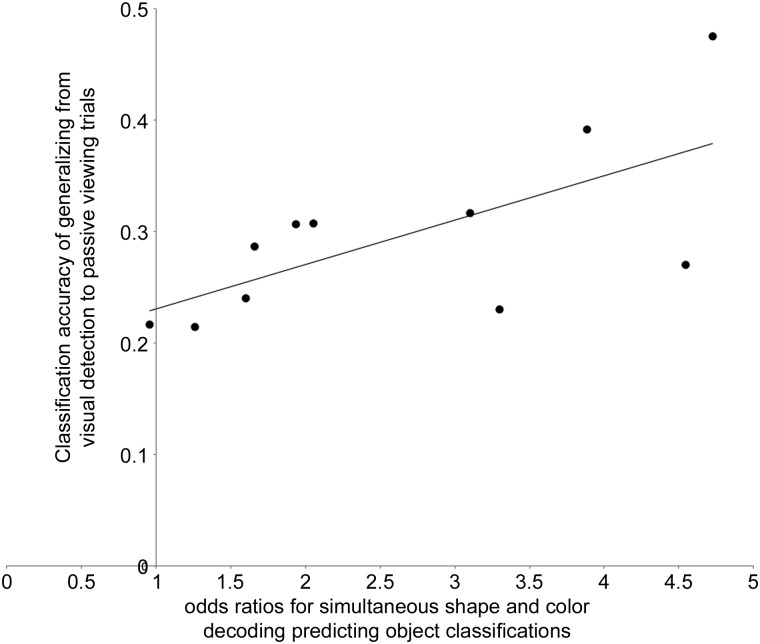
To make sense of the world around us, our brain must remember the overlapping features of millions of objects. Crucially, it must also represent each object's unique feature-convergence. Some theories propose that an integration area (or "convergence zone") binds together separate features. We report an investigation of our knowledge of objects' features and identity, and the link between them. We used functional magnetic resonance imaging to record neural activity, as humans attempted to detect a cued fruit or vegetable in visual noise. Crucially, we analyzed brain activity before a fruit or vegetable was present, allowing us to interrogate top-down activity. We found that pattern-classification algorithms could be used to decode the detection target's identity in the left anterior temporal lobe (ATL), its shape in lateral occipital cortex, and its color in right V4. A novel decoding-dependency analysis revealed that identity information in left ATL was specifically predicted by the temporal convergence of shape and color codes in early visual regions. People with stronger feature-and-identity dependencies had more similar top-down and bottom-up activity patterns. These results fulfill three key requirements for a neural convergence zone: a convergence result (object identity), ingredients (color and shape), and the link between them.

Keywords: anterior temporal lobe; convergence zone; integration; objects; semantic memory.


Figures

Figure 1.
Figure 1.
Experimental design. Participants were presented with cues of items to detect, followed by blocks of visual noise. Each block ended with an actual image embedded in noise, at a threshold that was determined for each participant before their scan (shown here at a low threshold for visualization purposes). Blocks contained an unpredictable amount of pure noise and occasionally ended with an incorrect (noncued) fruit or vegetable to keep participants on task. The objects in the final trial are displayed here in each corner although they could appear in any corner in the actual experiment. Every block ended with a unique instance of that kind of fruit or vegetable (e.g., no particular tangerine appeared more than once). Data associated with the last noise time-point (after accounting for the hemodynamic lag) were discarded to ensure that the signal-ascent from viewing the image-in-noise did not influence the analyzed data.
Figure 2.
Figure 2.
Location of searchlights with above-chance decoding of object identity while participants viewed visual noise and attempted to detect one of 4 kinds of fruit and vegetables. Left: A 4-way searchlight analysis revealed a region within the left ATL capable of decoding the target. Searchlight centers are shown in red. Right: The searchlights' volume displayed in one participant's original space, shown on their T1 anatomical image after automated cortical reconstruction and volumetric segmentation using the FreeSurfer image analysis package (Fischl et al. 2002).
Figure 3.
Figure 3.
Generalizing from top-down activity to visual perception. Left: A classifier was trained on activity patterns recorded as participants viewed visual noise and sought to detect a cued fruit or vegetable. The classifier model was then tested on activity recorded as participants viewed real images of category examples in a separate run. Center: Activity patterns in this analysis were extracted from the left temporal lobe searchlights identified in the prior analysis of noise trials alone. Right: Classification accuracy significantly exceeded chance-performance, reflecting successful generalization from anticipatory activity to visual perception. The dashed line reflects the level of chance and the error bar shows the standard error of the mean. The asterisk signifies above-chance classification performance (P < 0.05).
Figure 4.
Figure 4.
Feature-based generalization. Classifiers were trained to distinguish noise trials in which participants were searching for fruits and vegetables differing by shape or color. The classifiers were then tested on noise trials with the other pair of targets that differed in the same way. In the first example (left), classifiers are trained and tested based on shape (trained on lime vs. celery, tested on tangerine vs. carrot). In the second example (right), classifiers are trained and tested based on color (trained on lime vs. tangerine, tested on celery vs. carrot). The items took turns to act as the training data and the results of both comparisons were then averaged.
Figure 5.
Figure 5.
Classification results from the shape- and color-decoding analyses. Results are displayed from training a classifier on data from noise trials when participants were attempting to detect targets that differed by shape or color, and tested on data with other targets that varied in the same way. The shape results (e.g., training: lime vs. celery, testing: tangerine vs. carrot) are shown in red. The color results (e.g., training: tangerine vs. lime, testing: carrot vs. celery) are shown in blue. The dashed lines reflect the level of chance and the error bars show standard error of the mean. Asterisks signify above-chance classification performance (P < 0.05). The cross signifies trend-level performance (P < 0.1). The green region displayed in the cross section is in lateral occipital cortex. The red region is based on a color-responsive area, right V4 (Materials and Methods).
Figure 6.
Figure 6.
Individual differences in noise-to-visual generalization against the strength of the relationship between featural- and object-identity decoding. The y-axis represents each subject's classification performance from training on cued noise and testing on visual presentations of each fruit and vegetable in the ATL. The x-axis reflects each participant's odds ratio for the conjunction of color and shape decoding (in relevant feature regions) predicting cued-noise identity classifications in the ATL. A logistic regression model generated the odd ratios (details in Materials and Methods).

References

    1. Baron SG, Osherson D. 2011. Evidence for conceptual combination in the left anterior temporal lobe. Neuroimage. 55:1847–1852. - PubMed
    1. Binder JR, Gross WL, Allendorfer JB, Bonilha L, Chapin J, Edwards JC, Weaver KE. 2011. Mapping anterior temporal lobe language areas with fMRI: A multicenter normative study. Neuroimage. 54(2):1465–1475. - PMC - PubMed
    1. Binney RJ, Parker GJM, Lambon Ralph MA. 2012. Convergent connectivity and graded specialization in the rostral human temporal lobe as revealed by diffusion-weighted imaging probabilistic tractography. J Cogn Neurosci. 24(10):1998–2014. - PubMed
    1. Bouvier SE, Engel SA. 2006. Behavioral deficits and cortical damage loci in cerebral achromatopsia. Cereb Cortex. 16(2):183–191. - PubMed
    1. Bozeat S, Lambon Ralph MA, Patterson K, Garrard P, Hodges JR. 2000. Non-verbal semantic impairment in semantic dementia. Neuropsychologia. 38(9):1207–1215. - PubMed