

Novel approaches to improve iris recognition system performance based on local quality evaluation and feature fusion
- PMID: 24693243
- PMCID: PMC3943254
- DOI: 10.1155/2014/670934
Novel approaches to improve iris recognition system performance based on local quality evaluation and feature fusion
Abstract
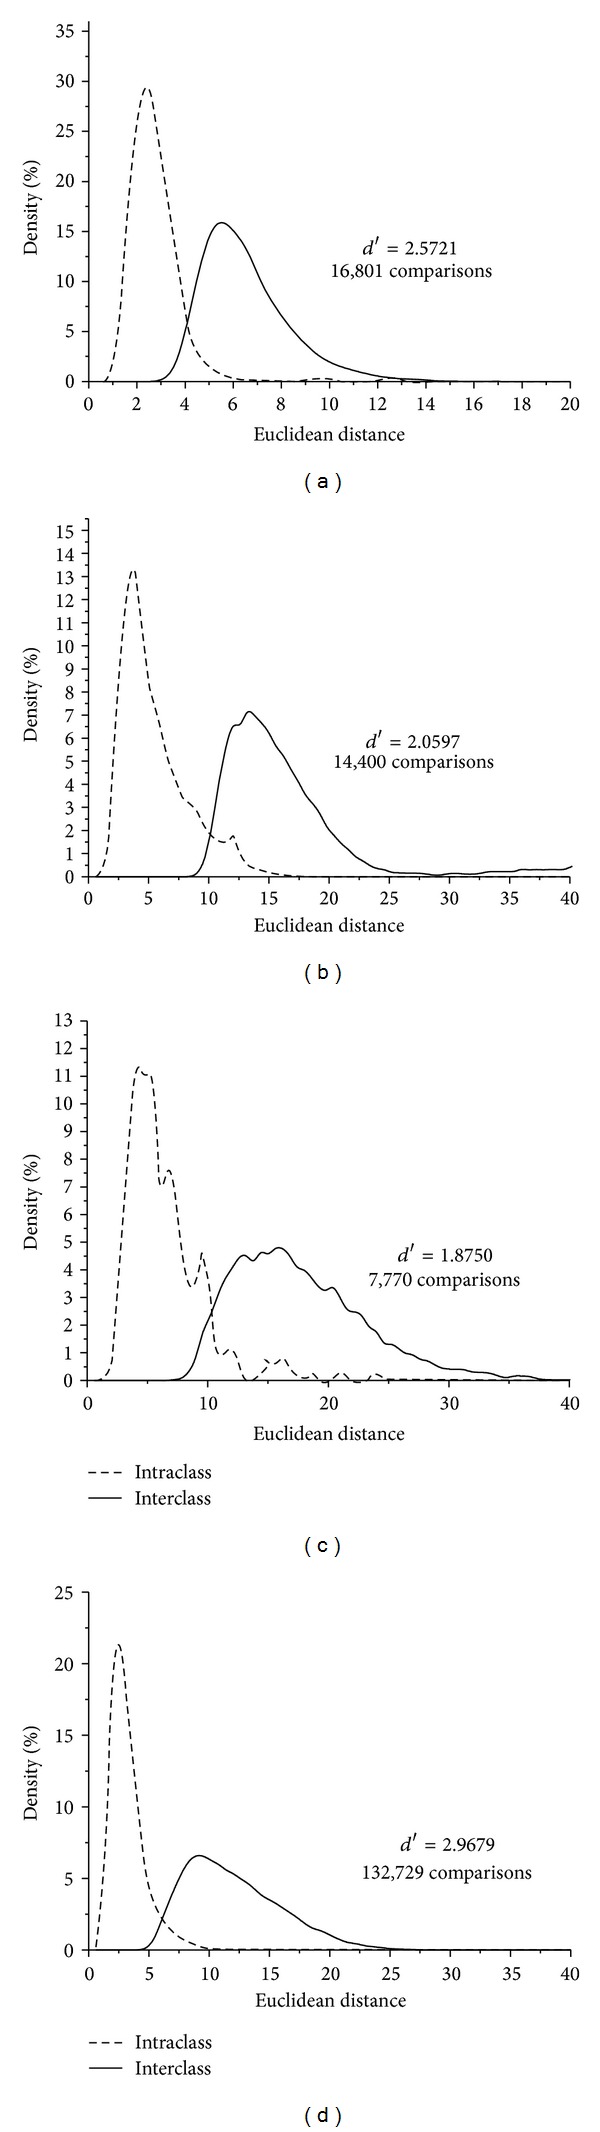
For building a new iris template, this paper proposes a strategy to fuse different portions of iris based on machine learning method to evaluate local quality of iris. There are three novelties compared to previous work. Firstly, the normalized segmented iris is divided into multitracks and then each track is estimated individually to analyze the recognition accuracy rate (RAR). Secondly, six local quality evaluation parameters are adopted to analyze texture information of each track. Besides, particle swarm optimization (PSO) is employed to get the weights of these evaluation parameters and corresponding weighted coefficients of different tracks. Finally, all tracks' information is fused according to the weights of different tracks. The experimental results based on subsets of three public and one private iris image databases demonstrate three contributions of this paper. (1) Our experimental results prove that partial iris image cannot completely replace the entire iris image for iris recognition system in several ways. (2) The proposed quality evaluation algorithm is a self-adaptive algorithm, and it can automatically optimize the parameters according to iris image samples' own characteristics. (3) Our feature information fusion strategy can effectively improve the performance of iris recognition system.
Figures


References
-
- Broussard RP, Kennell LR, Ives RW. Identifying discriminatory information content within the iris. Biometric Technology for Human Identification V; March 2008;
-
- Williams GO. Iris recognition technology. IEEE Aerospace and Electronic Systems Magazine. 1997;12(4):23–29.
-
- Du YZ, Ives R, Bonney B, Etter D. Analysis of partial iris recognition. The International Society for Optical Engineering; 2005; Orlando, Fla, USA. pp. 31–40.
-
- Du Y, Bonney B, Ives R, Etter D, Schnltz R. Analysis of partial iris recognition using a 1-D approach. Proceedings of the IEEE International Conference on Acoustics, Speech, and Signal Processing (ICASSP ’05); March 2005; pp. II961–II964.
-
- Hollingsworth KP, Bowyer KW, Flynn PJ. The best bits in an Iris code. IEEE Transactions on Pattern Analysis and Machine Intelligence. 2009;31(6):964–973. - PubMed
Publication types
MeSH terms
LinkOut - more resources
Full Text Sources
Other Literature Sources
